
 To view the complete sample trade table and explanation click here.
VSTpro 2010/2011 sample trade results. (US stocks)
To view the complete sample trade table and explanation click here.

Pullback trading using the VSTpro Part 7g
These two stocks were flagged in a "PullBack" exploration on the 24/11/2010.
The stocks selected for the exploration are those with a high "Profit/Risk ratio".
The charts will be updated weekly until stopped-out.
NOTE: The Trailing Stop for WOR has been amended from 3.5 ATRs to 2.5 ATRs.

Click on image to enlarge.


The stocks selected for the exploration are those with a high "Profit/Risk ratio".
The charts will be updated weekly until stopped-out.
NOTE: The Trailing Stop for WOR has been amended from 3.5 ATRs to 2.5 ATRs.
Click on image to enlarge.


Pullback trading using the VSTpro Part 7f
These two stocks were flagged in a "PullBack" exploration on the 24/11/2010.
The stocks selected for the exploration are those with a high "Profit/Risk ratio".
The charts will be updated weekly until stopped-out.
 Click on images to enlarge.

The table below will be updated to include additional stocks once testing of the Midline, and SmartStop parameters is completed.
 Click on image to enlarge.
The stocks selected for the exploration are those with a high "Profit/Risk ratio".
The charts will be updated weekly until stopped-out.
Click on images to enlarge.The table below will be updated to include additional stocks once testing of the Midline, and SmartStop parameters is completed.
Click on image to enlarge.


Experimenting with the VSTpro using the SmartStop
Stops to protect capital or as an exit, display different results when applied to a group of stocks using identical stop settings.
The VSTpro SmartStop has several parameters that can be adjusted enabling the user to fine tune the stop.
As an example the charts from the previous post had the Trailing Stop altered from 3.5 to 2.5 ATRs. Changing the Trailing ATR by 1.0 has impacted on the trading results and these changes can be viewed below.
 Click on images to enlarge.

The VSTpro SmartStop has several parameters that can be adjusted enabling the user to fine tune the stop.
As an example the charts from the previous post had the Trailing Stop altered from 3.5 to 2.5 ATRs. Changing the Trailing ATR by 1.0 has impacted on the trading results and these changes can be viewed below.
Click on images to enlarge.
Pullback trading using the VSTpro Part 7e
These two stocks were flagged in a "PullBack" exploration on the 24/11/2010.
The stocks selected for the exploration are those with a high "Profit/Risk ratio".
The charts will be updated weekly until stopped-out.
The entry is a close below the Mid line, and the exit is triggered when the price closes below the SmartStop.
 Click on images to enlarge.

The stocks selected for the exploration are those with a high "Profit/Risk ratio".
The charts will be updated weekly until stopped-out.
The entry is a close below the Mid line, and the exit is triggered when the price closes below the SmartStop.
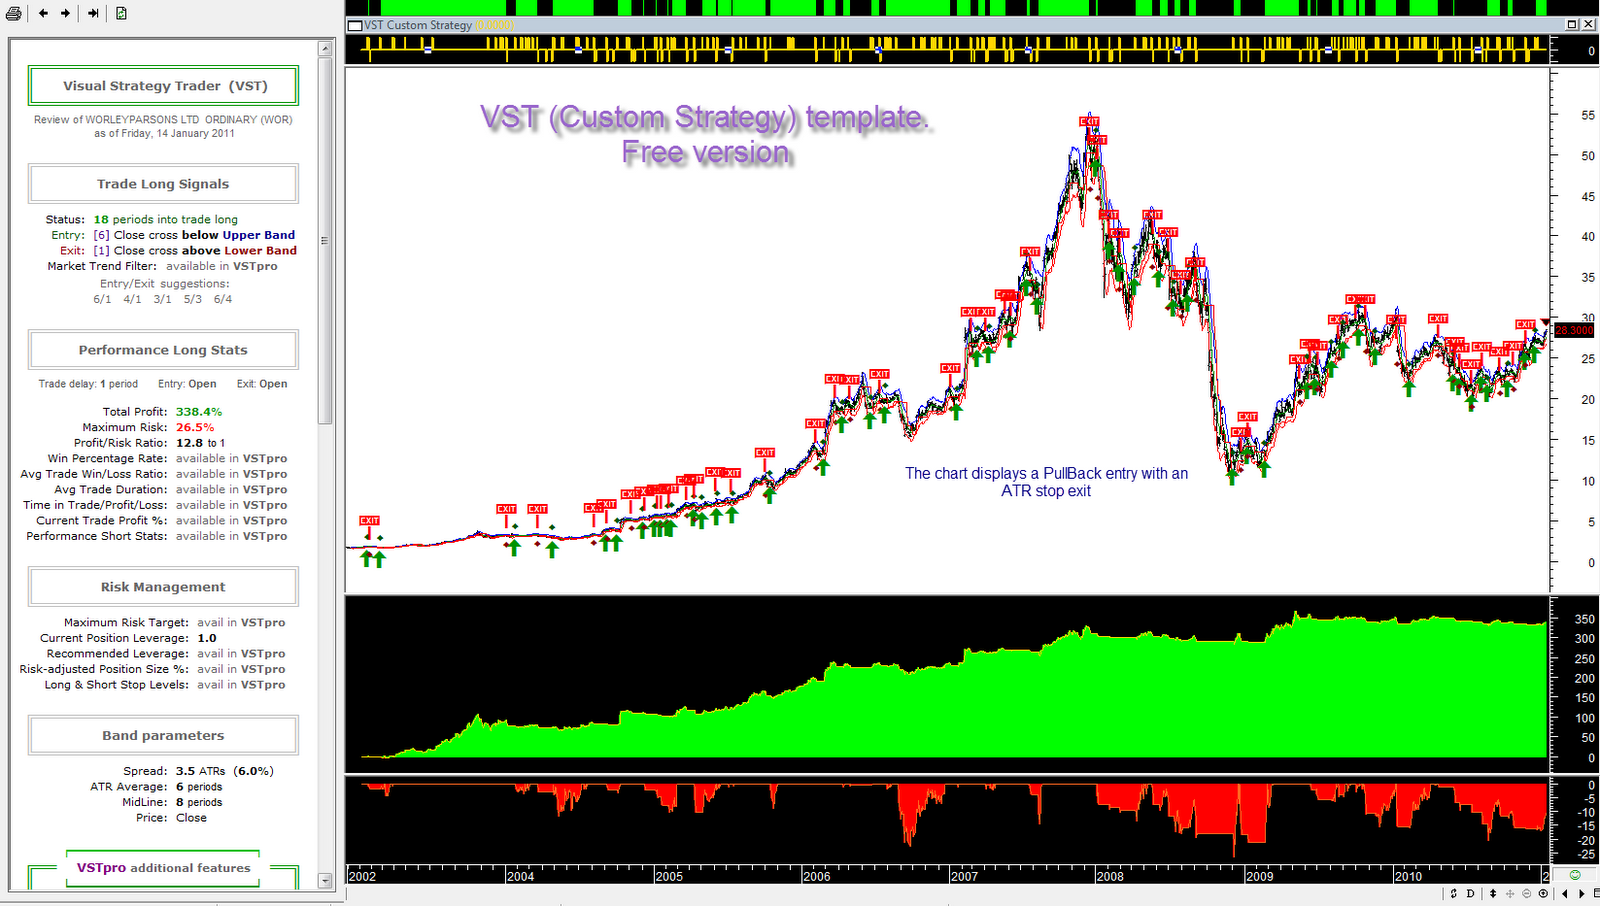
Click on images to enlarge.VST (Custom Strategy) PullBack indicator.
Most charts on this blog are constructed using the VSTpro but at times the free VST (Custom Strategy) is ideal to quickly test indicators.
The VST (Custom Strategy), free version, is a powerful tool for testing entry/exits, and if by mistake the code fails to work, just re-install to the original settings.
The code is open, and this PullBack example the VST bands indicator has been modified to use the Mid band and an ATR stop.
Entry=Close cross below Mid band.
Exit=Close cross below ATR stop.
The Mid band is set to [8] and could be adjusted to 10 or 12 etc. (see image below)
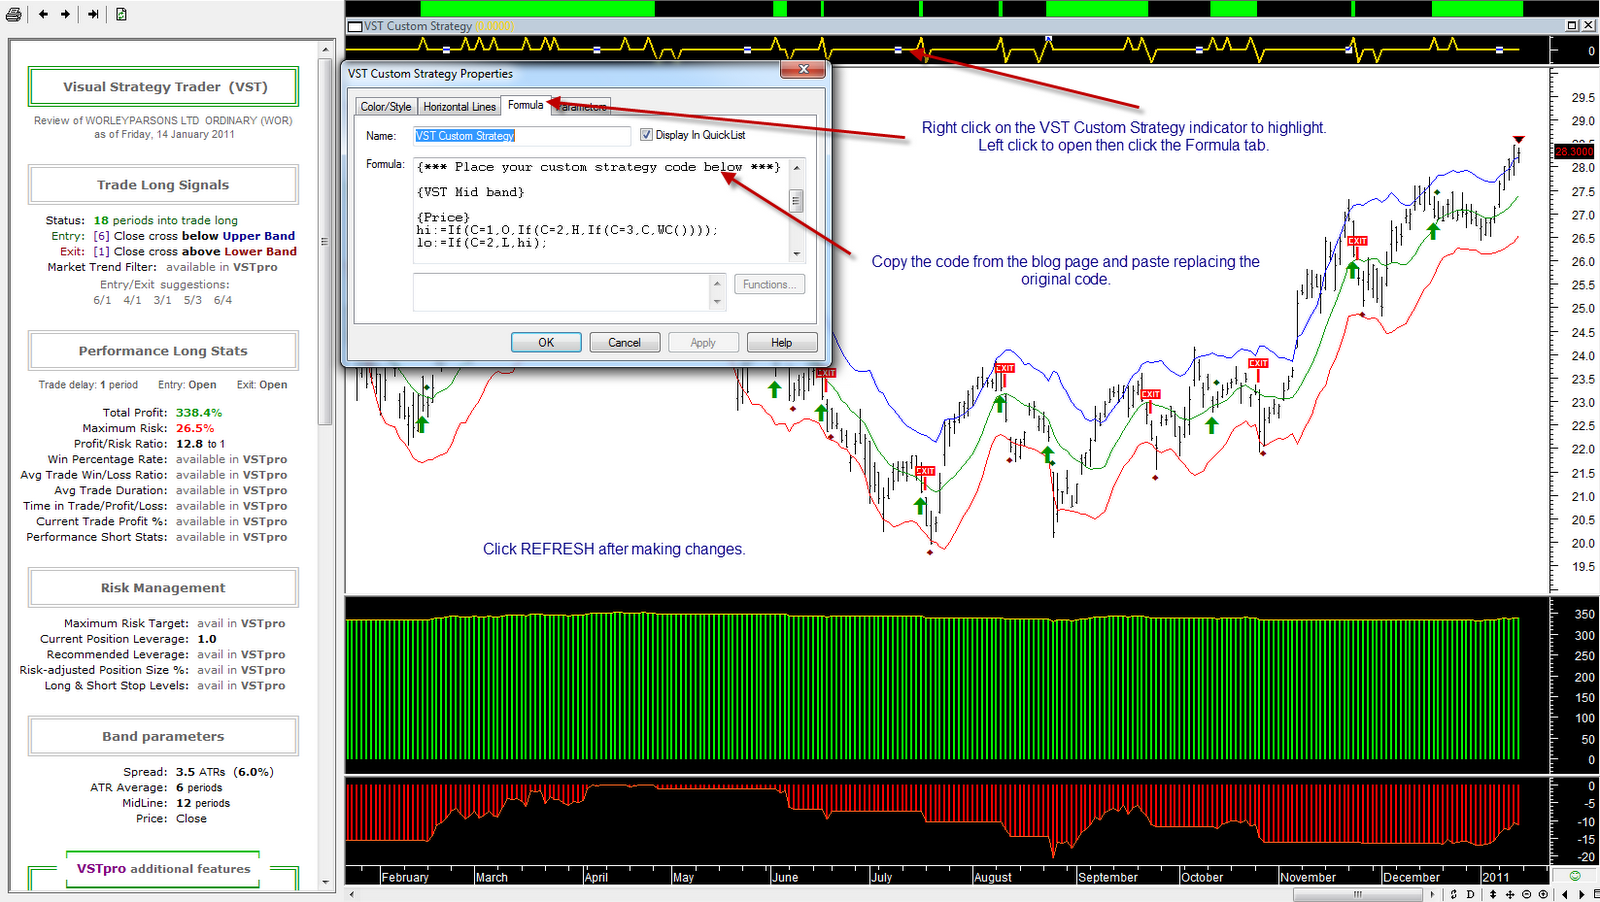
Copy and paste the code, between the lines, into the VST Custom Strategy indicator.
This can be via the chart by opening the indicator as per the image below
or
By opening the indicator via the MetaStock Indicator Builder.
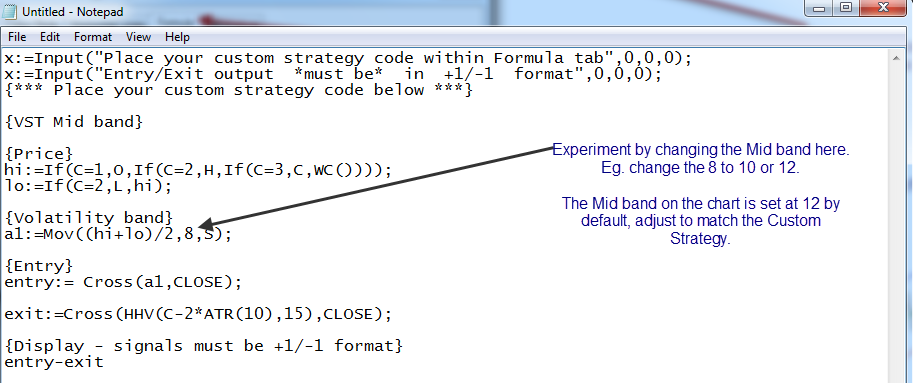
{-------------------------------copy below this line--------------------------------------}
x:=Input("Place your custom strategy code within Formula tab",0,0,0);
x:=Input("Entry/Exit output *must be* in +1/-1 format",0,0,0);
{*** Place your custom strategy code below ***}
{VST Mid band}
{Price}
hi:=If(C=1,O,If(C=2,H,If(C=3,C,WC())));
lo:=If(C=2,L,hi);
{Volatility band}
a1:=Mov((hi+lo)/2,8,S);
{Entry}
entry:= Cross(a1,CLOSE);
{Exit}
exit:=Cross(HHV(C-2*ATR(10),15),CLOSE);
{Display - signals must be +1/-1 format}
entry-exit
{----------------------------copy above this line--------------------------------}
The VST and VST (Custom Strategy) are free to download and use.(see top menu on blog page.)
 Click on images to enlarge.
The VST (Custom Strategy), free version, is a powerful tool for testing entry/exits, and if by mistake the code fails to work, just re-install to the original settings.
The code is open, and this PullBack example the VST bands indicator has been modified to use the Mid band and an ATR stop.
Entry=Close cross below Mid band.
Exit=Close cross below ATR stop.
The Mid band is set to [8] and could be adjusted to 10 or 12 etc. (see image below)
Copy and paste the code, between the lines, into the VST Custom Strategy indicator.
This can be via the chart by opening the indicator as per the image below
or
By opening the indicator via the MetaStock Indicator Builder.
{-------------------------------copy below this line--------------------------------------}
x:=Input("Place your custom strategy code within Formula tab",0,0,0);
x:=Input("Entry/Exit output *must be* in +1/-1 format",0,0,0);
{*** Place your custom strategy code below ***}
{VST Mid band}
{Price}
hi:=If(C=1,O,If(C=2,H,If(C=3,C,WC())));
lo:=If(C=2,L,hi);
{Volatility band}
a1:=Mov((hi+lo)/2,8,S);
{Entry}
entry:= Cross(a1,CLOSE);
{Exit}
exit:=Cross(HHV(C-2*ATR(10),15),CLOSE);
{Display - signals must be +1/-1 format}
entry-exit
{----------------------------copy above this line--------------------------------}
The VST and VST (Custom Strategy) are free to download and use.(see top menu on blog page.)
Click on images to enlarge.


Pullback trading using the VSTpro Part 7d
 Click on images to enlarge.
 These two stocks were flagged in a "PullBack" exploration on the 24/11/2010.
The stocks selected for the exploration are those with a high "Profit/Risk ratio".
The charts above will be updated weekly until stopped-out.
VSTpro 2010 sample trade results. (US stocks)
 Click here to view the complete sample trade table and explanation.
The past 12 months results prove the VSTpro is worth its weight in gold.
Visit metastocktools.com for full details.
Subscribe to:
Posts (Atom)


