
Click on image to enlarge.

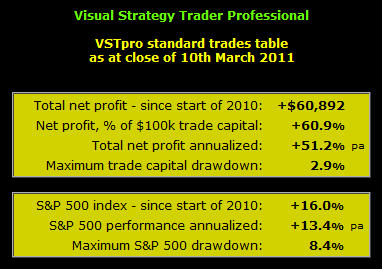
Using the "Visual Strategy Trader" platform
to demonstrate results from different entry/exit systems in MetaStock.


 To view the complete sample trade table and explanation click here.
 Click on images to enlarge.
 The chart above is from the trade table.
 Click on image to enlarge.

 To view the complete sample trade table and explanation click here.
 Click on images to enlarge.


 Click on images to enlarge.
 Click on image to Enlarge.


 Click on images to enlarge.
 The Learn MetaStock website contains ( Indicators, articles, videos, interviews, MetaStock help

 Click on image above enlarge.
 To view the complete sample trade table and explanation click here.


