VST - Testing stoploss impact on trading results.

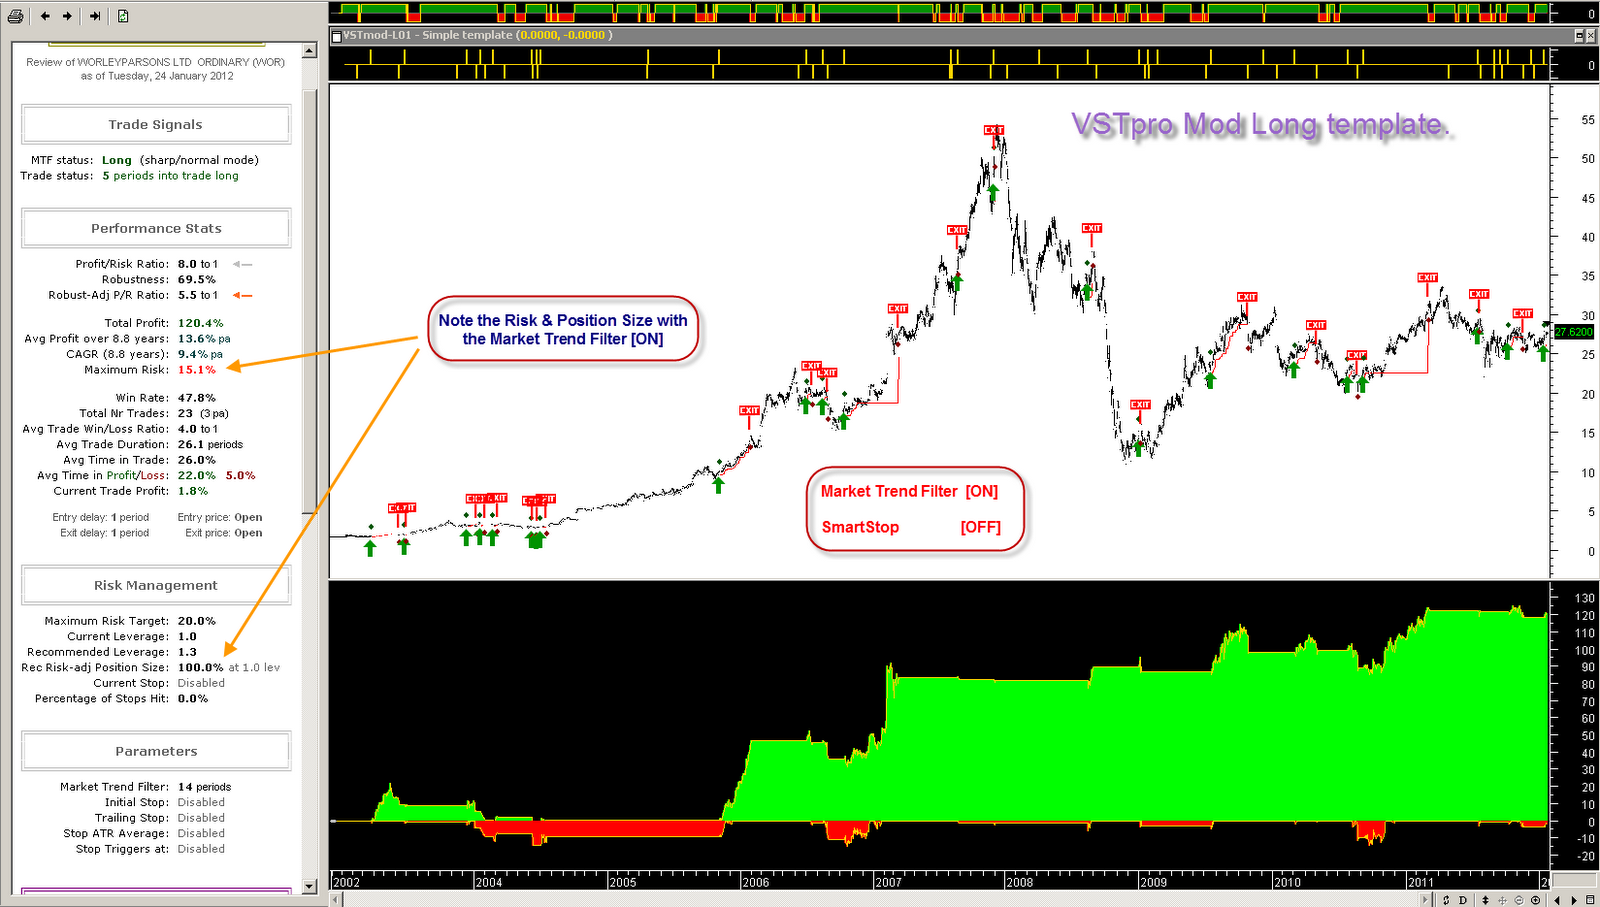
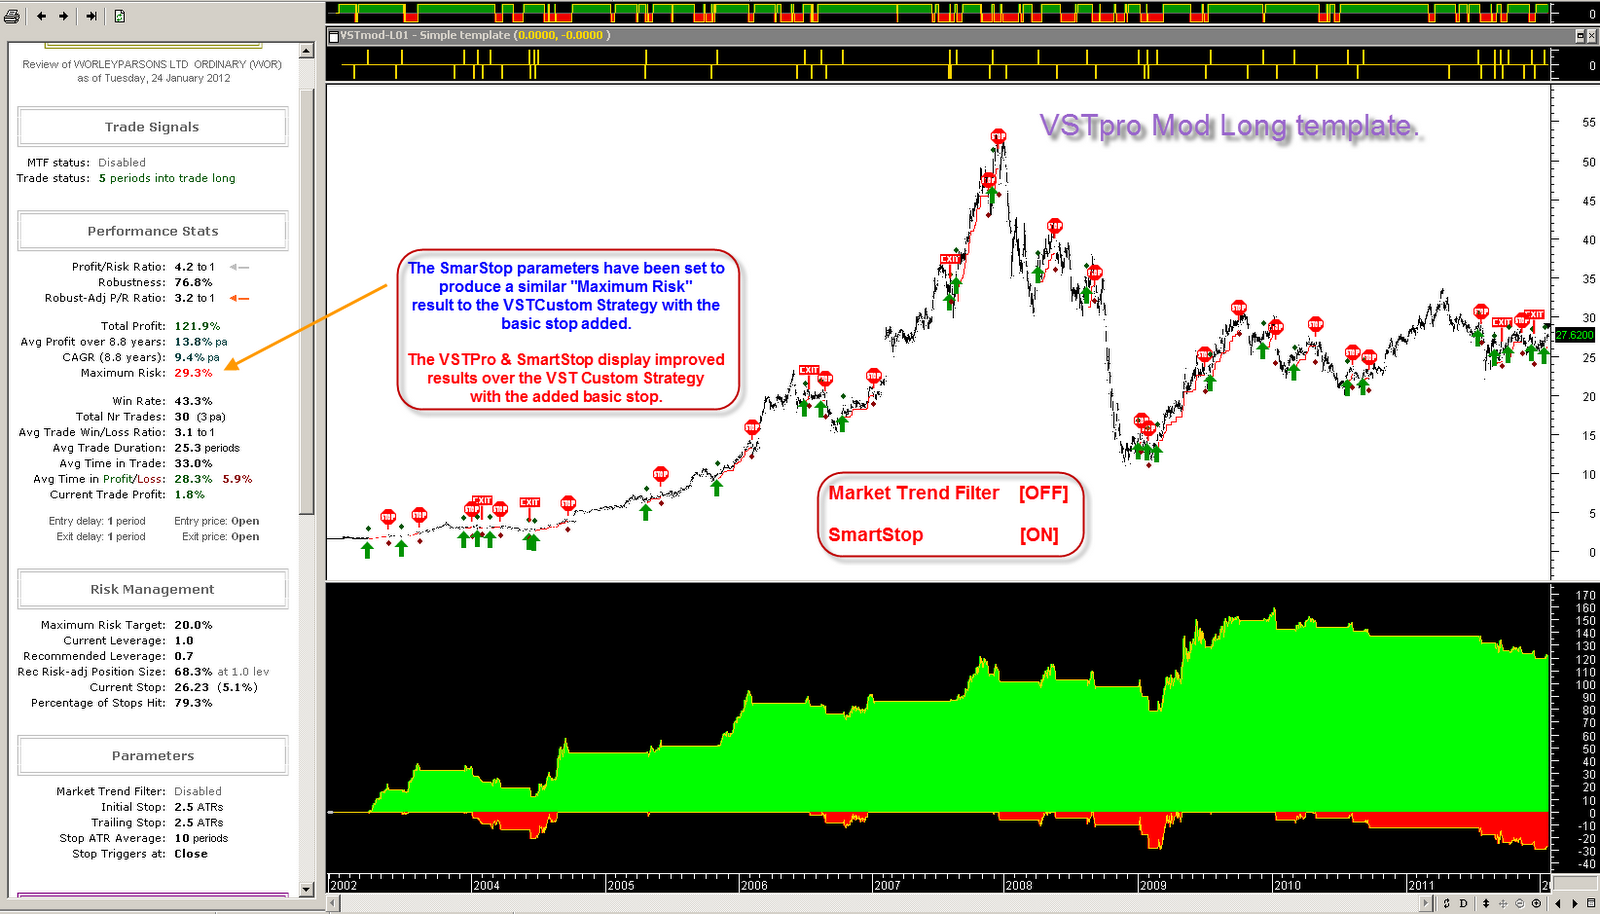
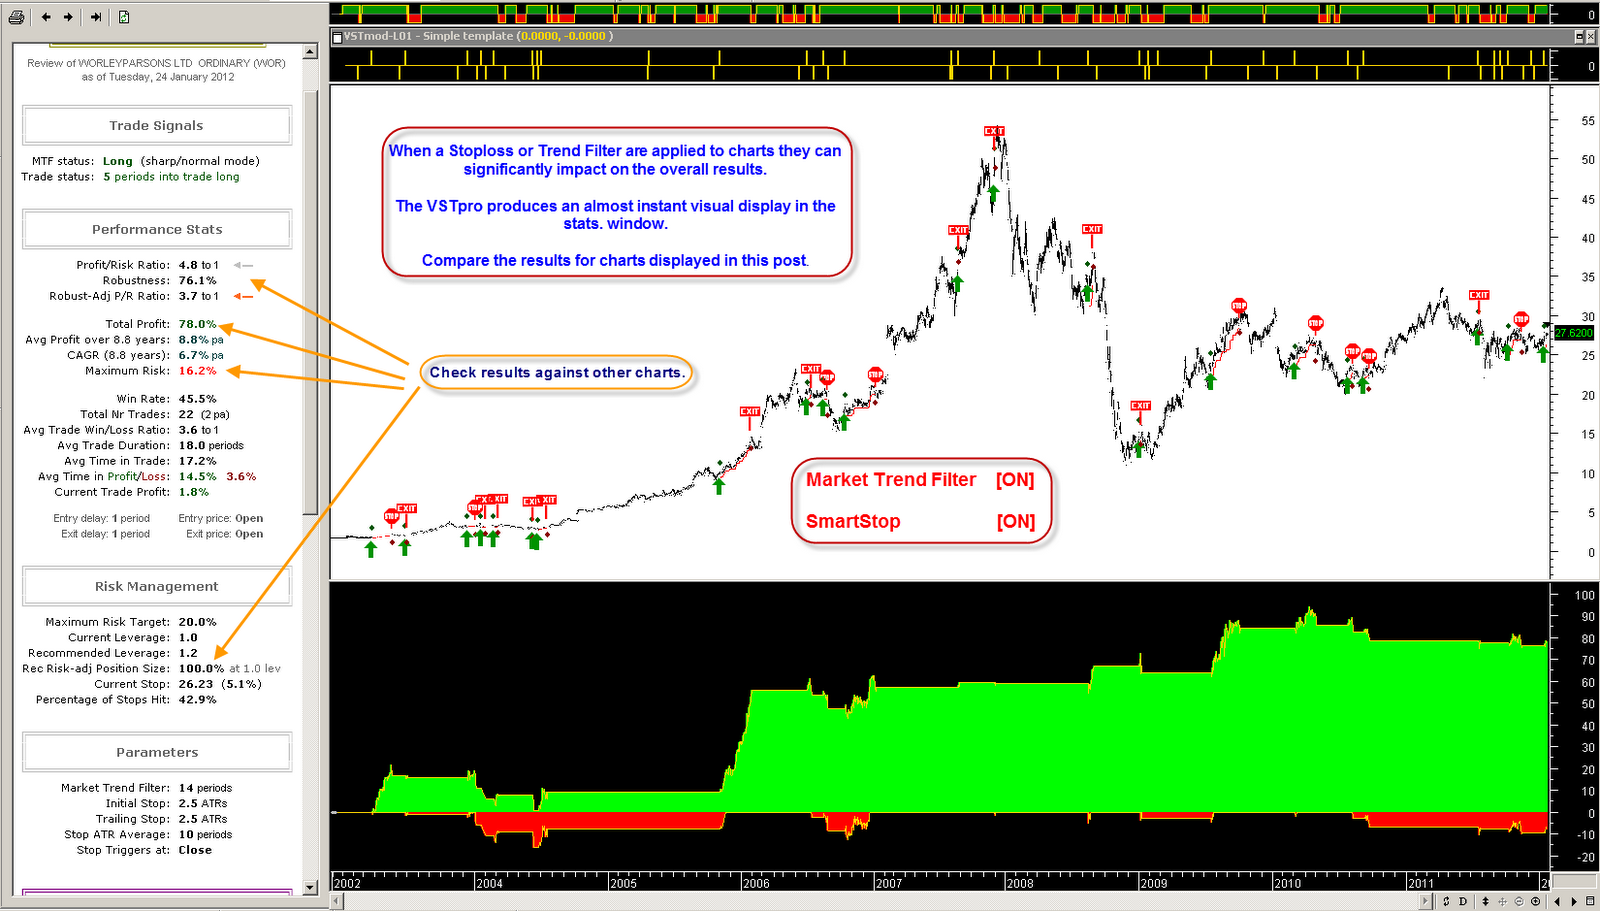
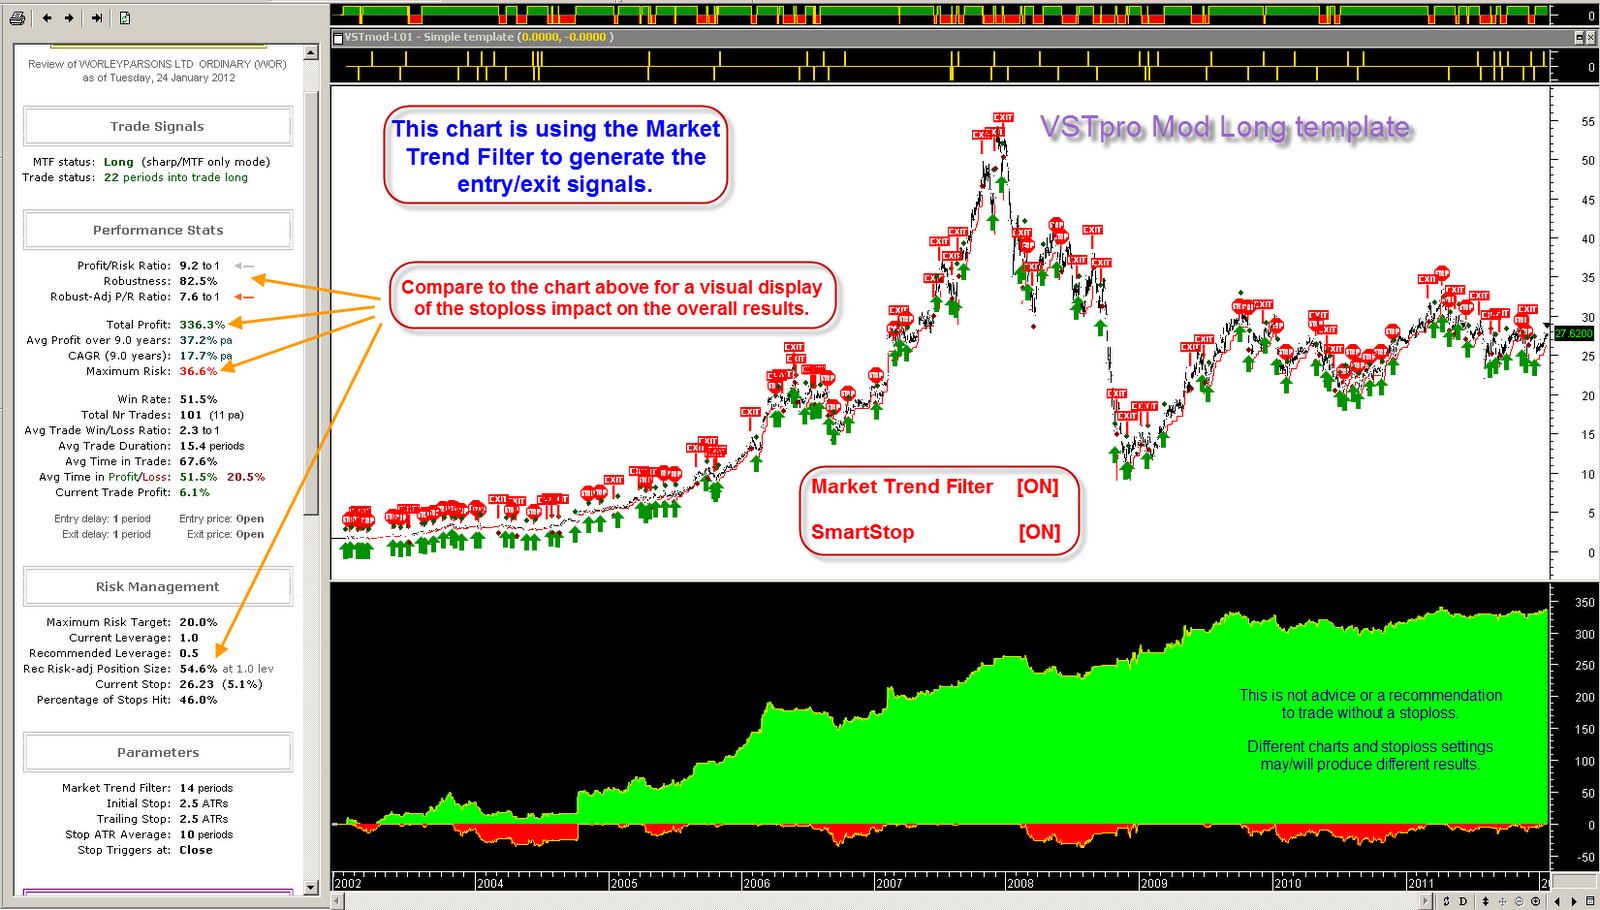
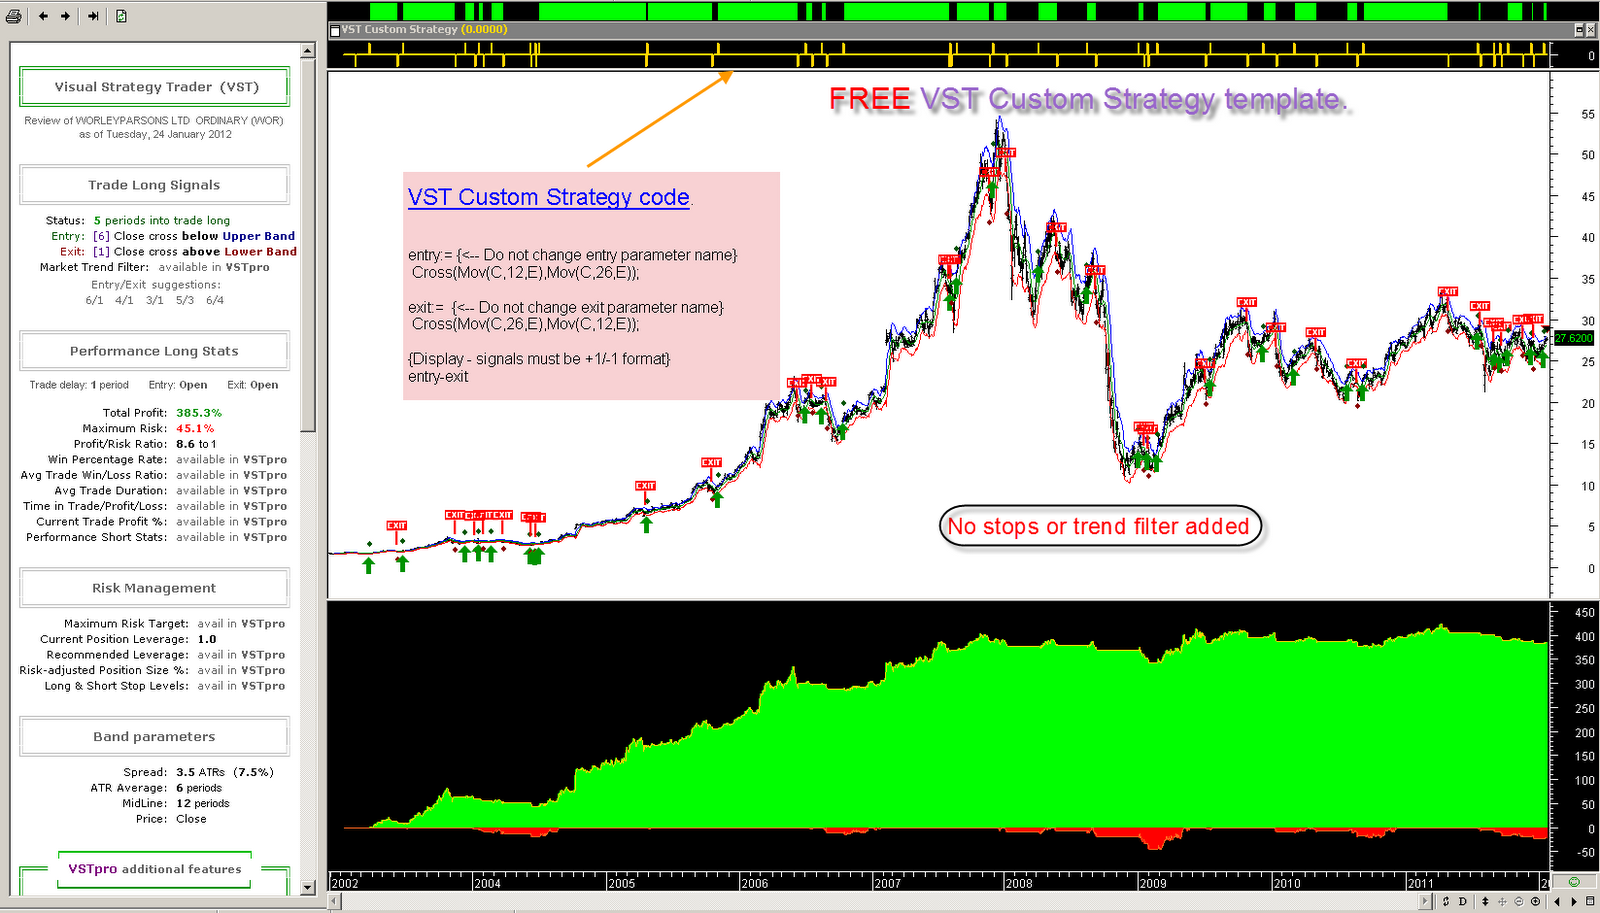
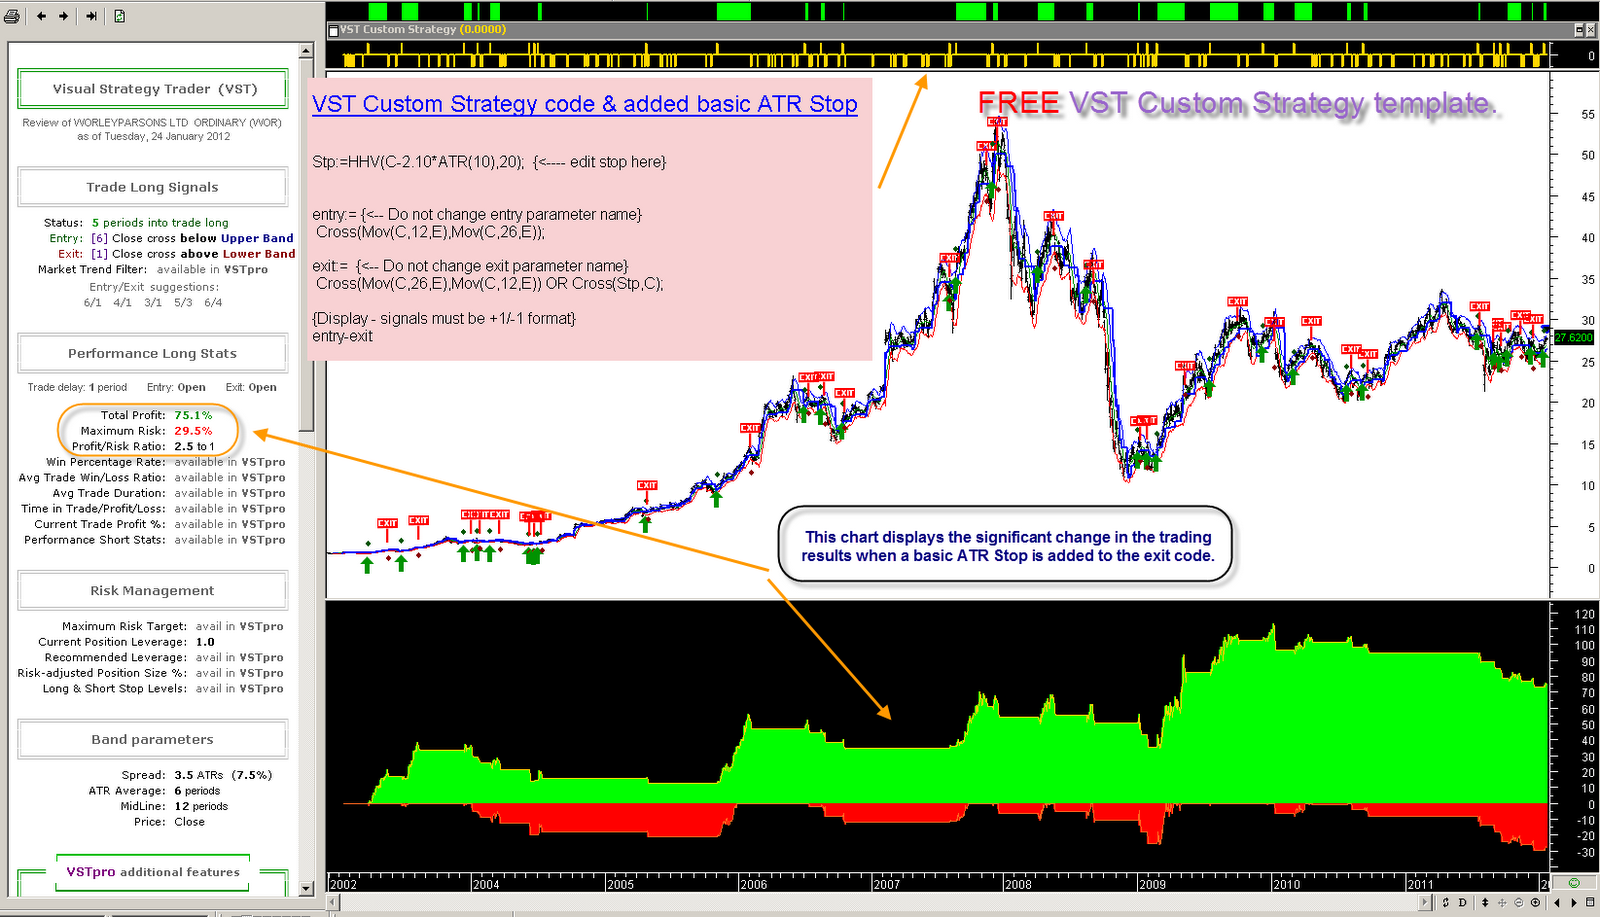
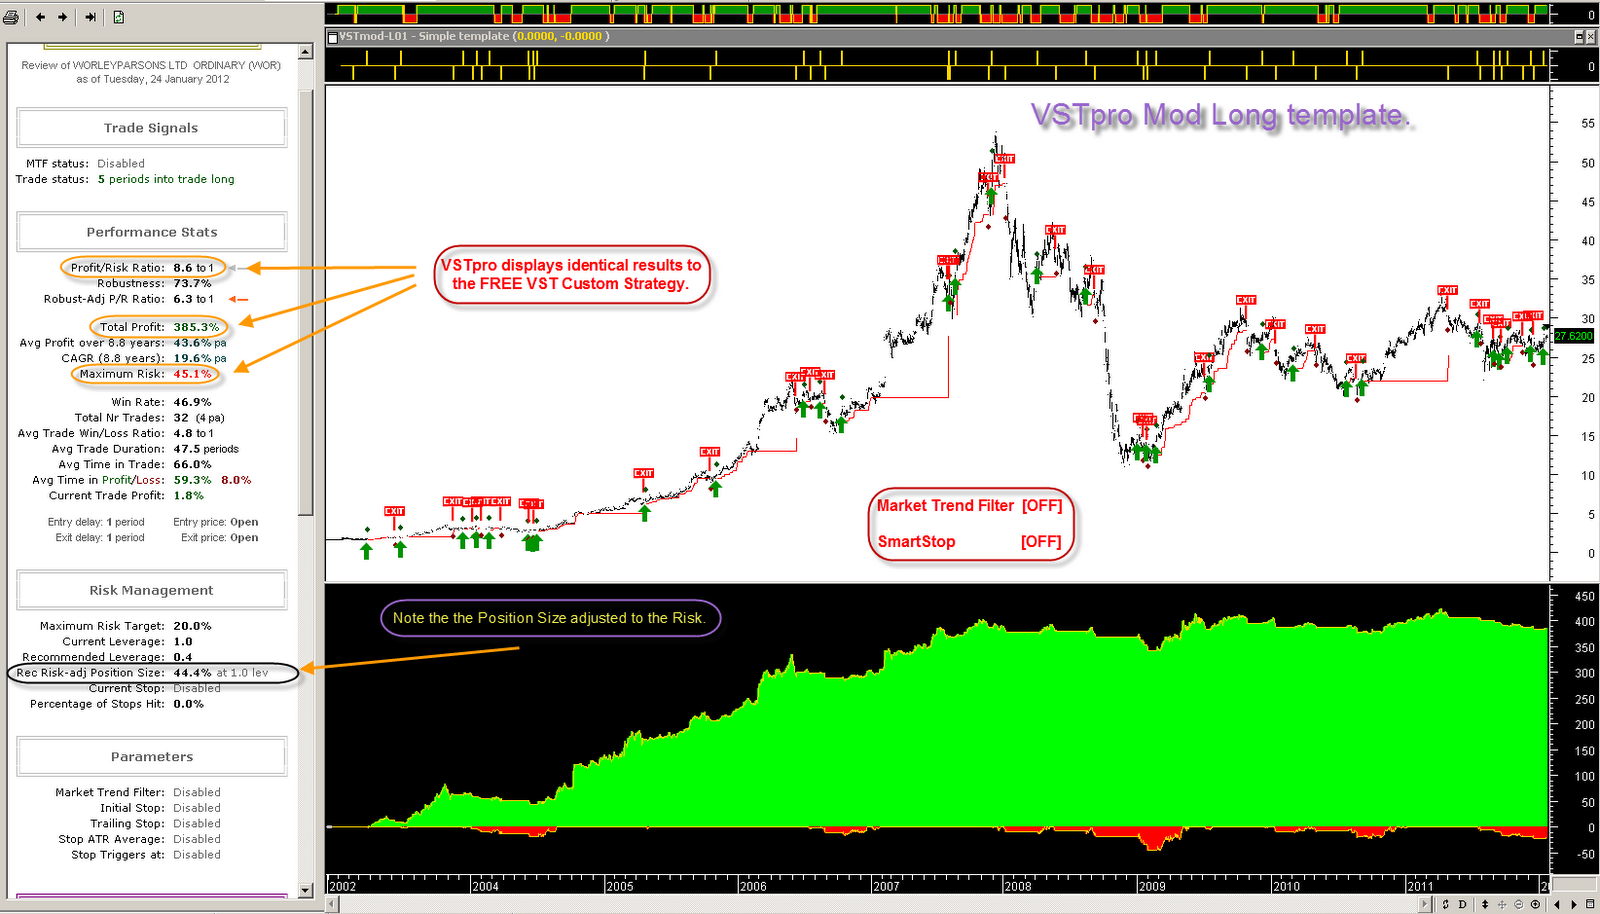
The charts below have been constructed using the FREE VST Custom Strategy and the VSTpro.

The stats. window displays the results for the different setups.


Click on the charts to enlarge.


Click on the charts to enlarge.


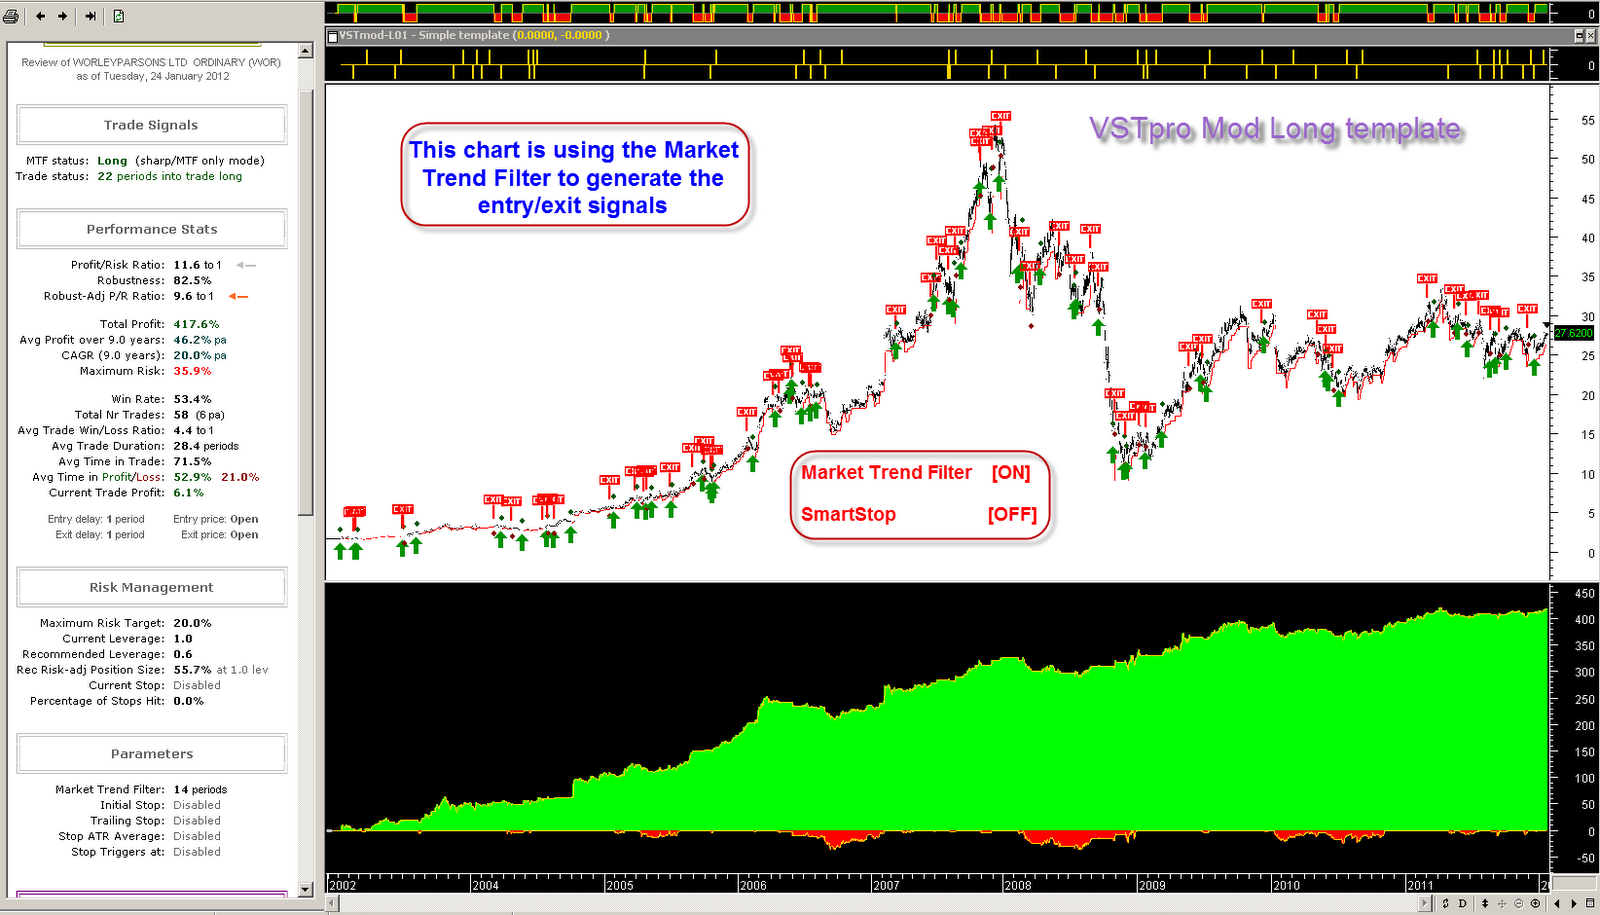
The charts below are setup to use the Market Trend Filter to generate the entry/exit signals.

The Market Trend Filter is over-riding the indicator entry/exit signals.
Click on chats to enlarge.

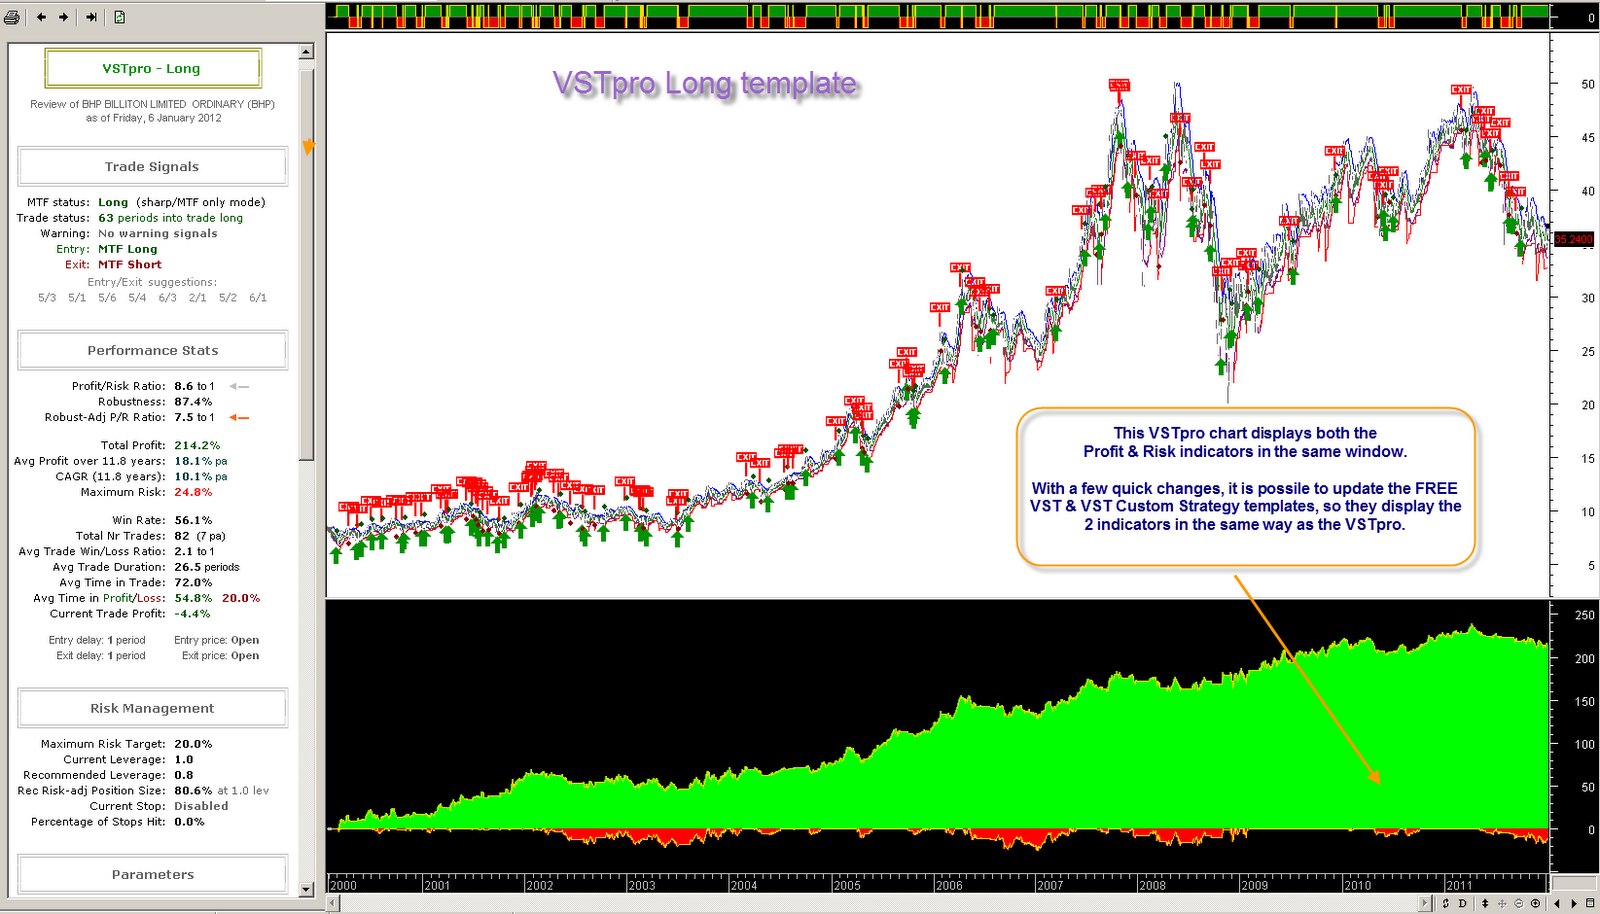
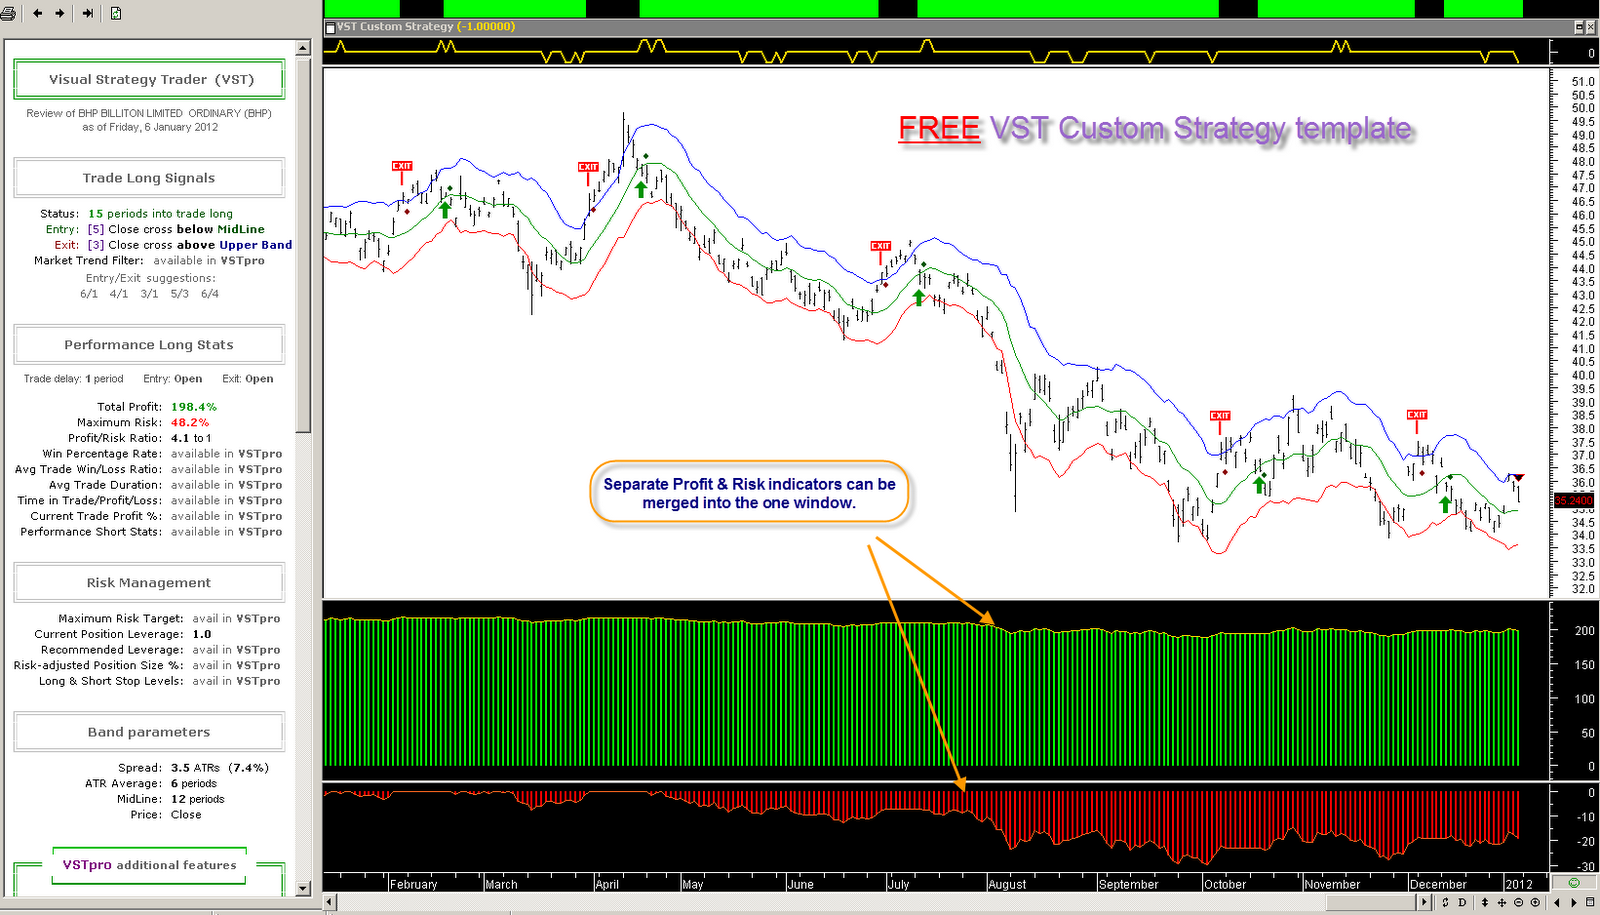
FREE VST & VST Custom Strategy - Profit & Risk indicator modification.

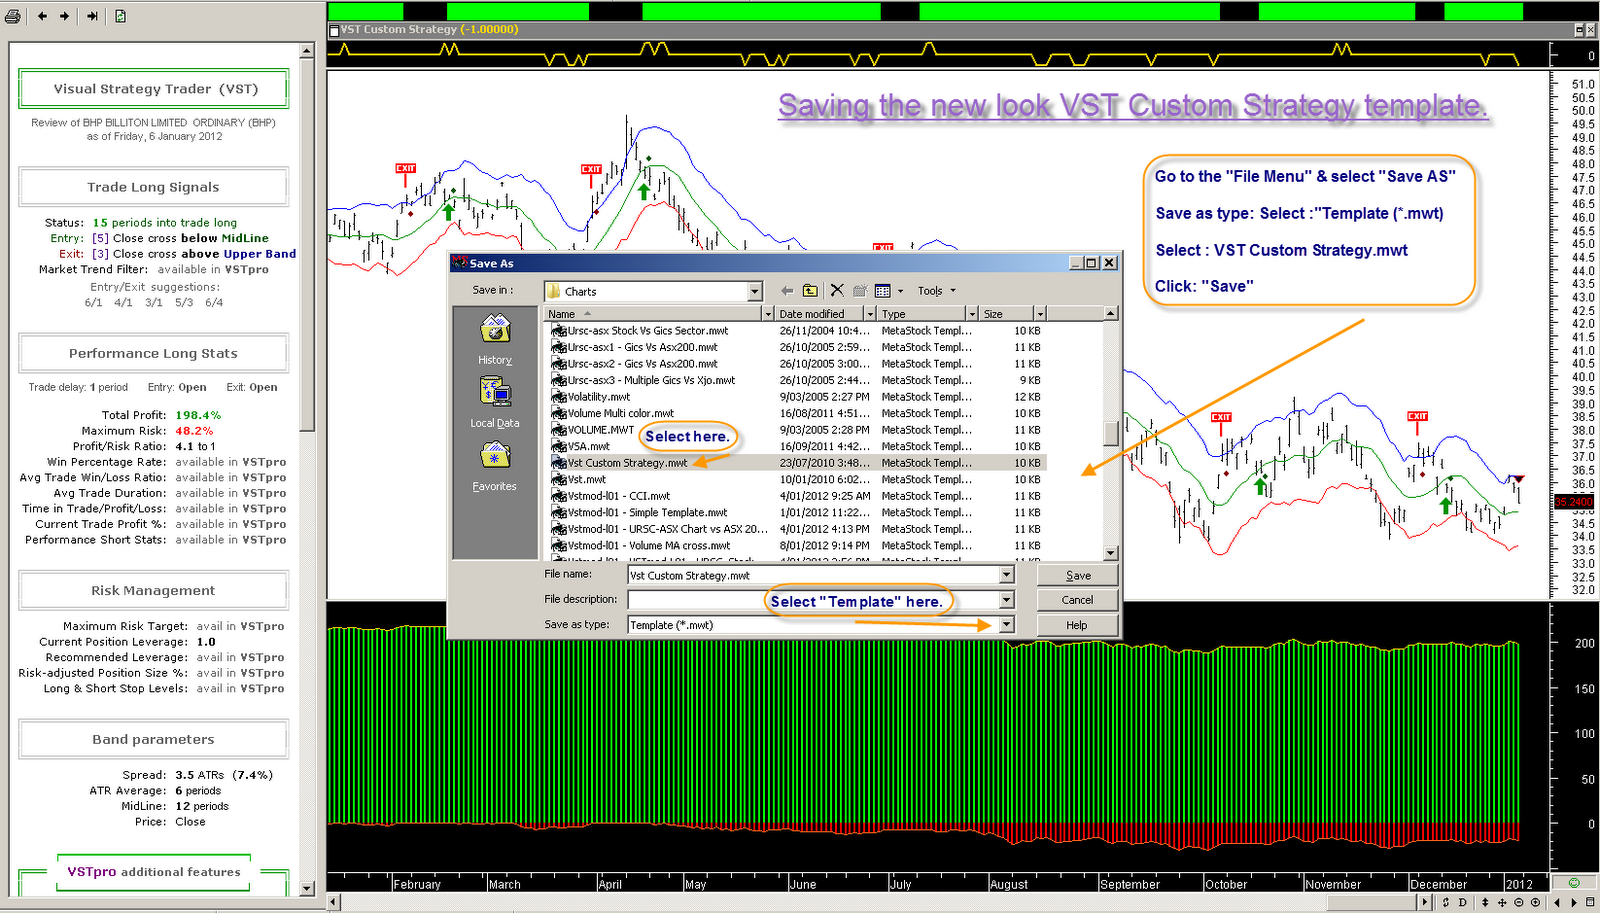
With a few quick steps the Profit and Risk indicators can be setup in the same window.

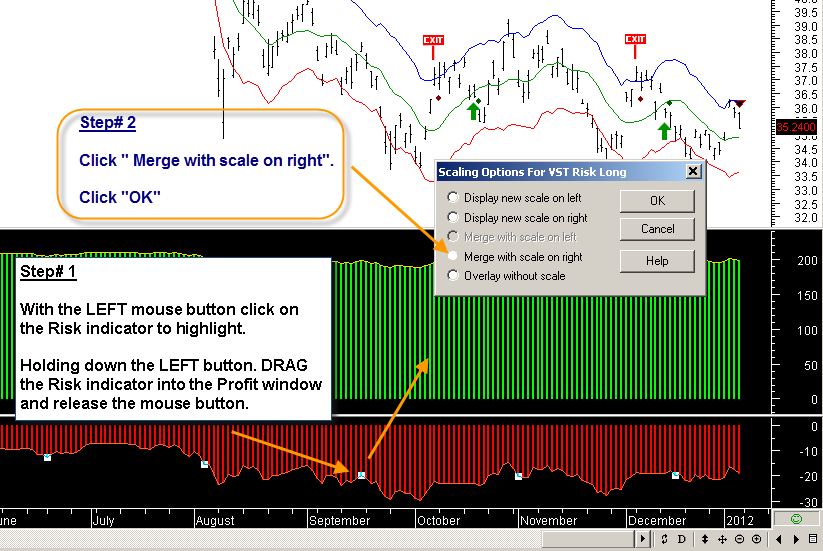
  • Highlight the Risk indicator.
  • Drag the Risk indicator in to the Profit window.
  • Merge with the scale on right.
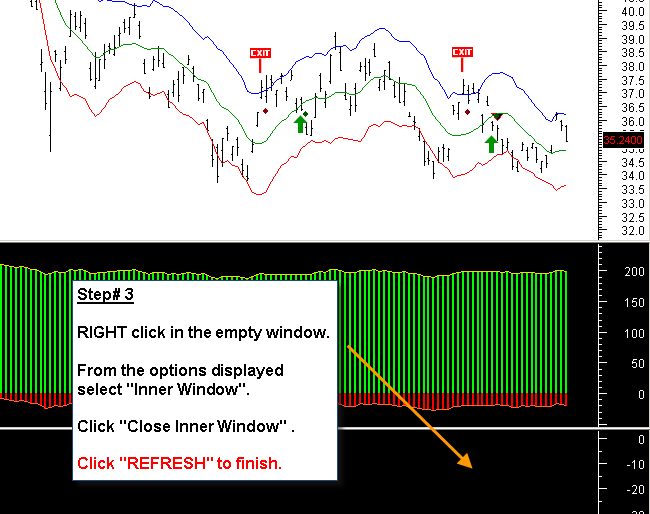
  • Delete the empty Risk indicator window.
  • To make the changes permanent "Save As" a template.
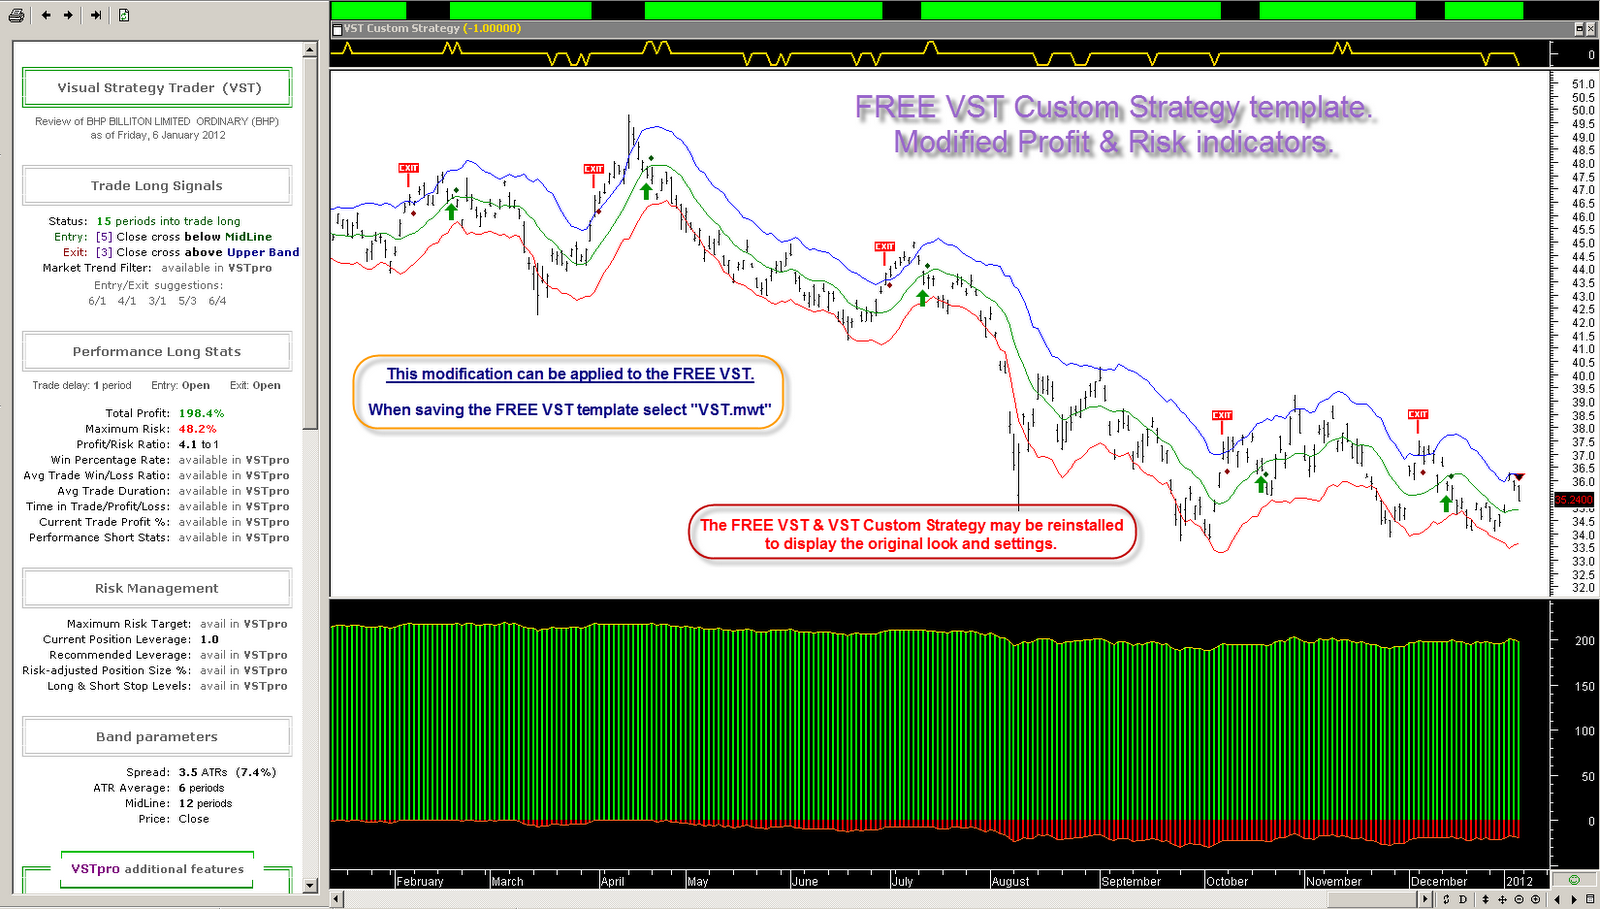
The charts below display the steps required to make the changes.

If at any stage problems arise the VST & Custom Strategy may be reinstalled.

The VST must be installed first, followed by the VST Custom Strategy.


Click on images to enlarge.


Click on images to enlarge.


VSTpro - New stats added.

Recently Jose Silva added two extra stats to the VSTpro templates.

  • Description : Latest update to Robustness formulae, added Avg Profit pa% and CAGR (Compound Annual Growth Rate) - 6 Dec 2011.

  • For information about CAGR (Compound Annual Growth Rate), visit Investopedia.comto view a detailed explanation and short video presentation.

Click on image to enlarge.

VST (FREE Version) Band Signal Exploration

Running the FREE VST Signal exploration for 2/12/2011 on the ASX All Ordinaries (500 stocks), and using the 5/3 settings, only 3 stocks gave a signal.

Security Name Ticker Symbol

CODAN LIMITED CDA
COUNTRY ROAD LIMITED CTY
NEXUS ENERGY LIMITED NXS

NXS charts below have added text.

For FREE VST downloads visit the download link on this blog.


Click on images to enlarge.


VSTpro 2010/2011 sample trade results. (US stocks)

Click on links below.

2010 | 2011 | Details | Disclaimer

GICS Indices vs ASX 200 2/12/2011

Click on image to enlarge.

Banks vs ASX 200 2/12/2011

Click on image to enlarge.

VSTpro Long/Short Profit/Risk Indicator (New)

Jose Silva from metastocktools.com has recently released the " VSTpro Long/Short Profit/Risk " indicator for the VSTpro platform.

This indicator will be of most interest to traders who combine both Long/Short strategies.

Notes....
  • Two open charts are required, Long and Short VSTpro templates applied.
  • Charts and strategies can be mixed.
  • The new VSTpro Long/Short Profit/Risk indicator is dropped into the VSTpro Long Profit or Short Profit indicators, and merged.
  • The combined indicators now display the visual results for the Long profit + Short profit.
With the VSTpro "Open code" it only takes a few minutes to add an extra line in the stats window to display the numerical results. Both Long and Short VSTpro templates must be open to display correct results.


Click on images to enlarge.


VSTpro Long & Short - Time templates S&P 500 ($SP)

The charts below have the VSTpro Time templates applied, and look back over the previous 12 months.

The charts display.
  • Buy/hold.
  • Market Trend Filter Long signals.
  • Market Trend Filter Short signals.
Charts have added text and the results are displayed in the commentary window.

VSTpro Time templates may be setup to cover any period.

Click on images to enlarge.


Design Credit Best Blogger Tips | Best Blogger Templates | Best Social Icons