VSTpro Long - Time template.

Charts displayed below have the VSTpro Long - Time template applied.

Settings for all charts are identical.

  • VSTpro Long - Date Filter indicator is set at 4/10/2011 to 21/2/2012.
  • VSTpro Long - Time Profit indicator set to Buy/Hold & zero for Transaction Costs.


Click on images to enlarge.


VSTpro 2010/2011/2012 sample trade results. (US stocks)

Click on links below.

2010 | 2011 | Details | Disclaimer

GICS Indices vs ASX 200 17/2/2012

Click on image to enlarge.

MetaStock Training-Live-Webinar-Learn-Classes-click here

Banks vs ASX 200 17/2/2012

Click on image to enlarge.

MetaStock Training-Live-Webinar-Learn-Classes-click here

VST testing trading systems and indicators.

The VST Custom Strategy can produce a quick visual display to help in determining the performance of indicators / systems.

Once the indicator / system is placed into the VST Custom Strategy or VSTpro the parameters can be adjusted with an almost instant visual update of the stats.

To view how the VSTpro can assist in evaluation of indicators / systems visit the Equis forum here. Scroll down to the VSTpro charts.

Forum member " henery1224 " has posted several charts using the VSTpro. These charts give a visual display, and the stats. window reports the results.

The chart below has the FREE VST Custom Strategy template applied, and is using an indicator from the Equis forum.

Click on image to enlarge.

Visit the Equis forum here.

VSTpro 2010/2011/2012 sample trade results. (US stocks)

Click on links below.

2010 | 2011 | Details | Disclaimer

GICS Indices vs ASX 200 10/2/2012

Click on image to enlarge.

MetaStock Training-Live-Webinar-Learn-Classes-click here

Banks vs ASX 20010/2/2012

Click on image to enlarge.

MetaStock Training-Live-Webinar-Learn-Classes-click here

VSTpro Explorations.

VSTpro owners have access to a closed user group, and a few days ago a group member ask a question about setting up the Market Trend Filter (MTF) in a different way.

The best way to demonstrate the difference between the setups was to run two exploration.

A major part of the VSTpro is the powerful exploration function.

The images below display the templates and results.

Click on images to enlarge.


Click on images to enlarge.


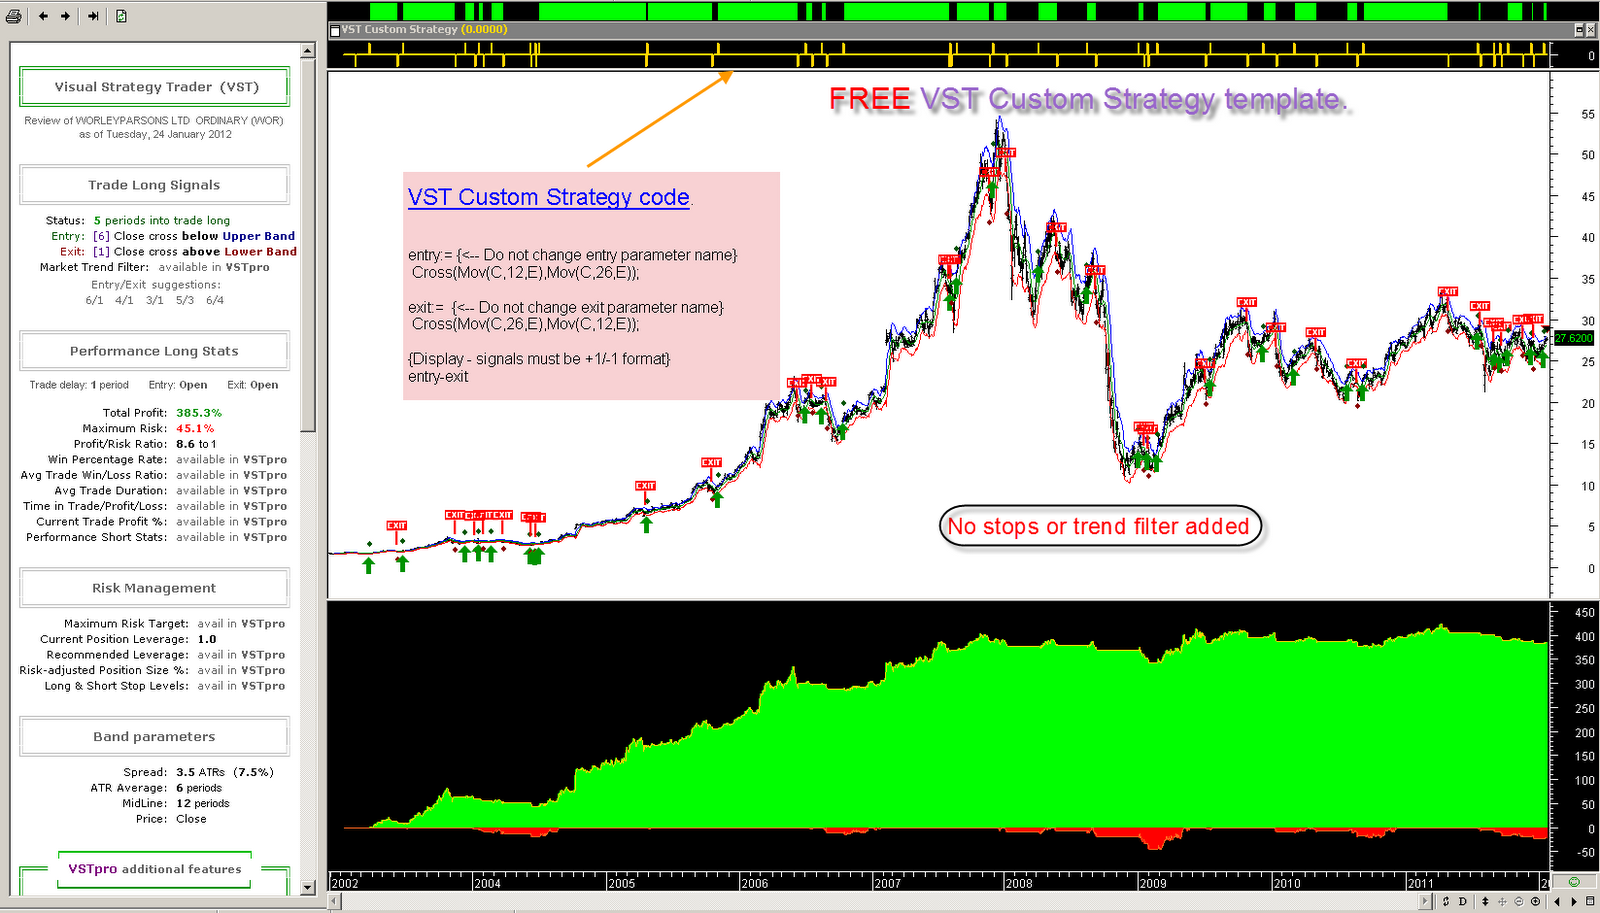
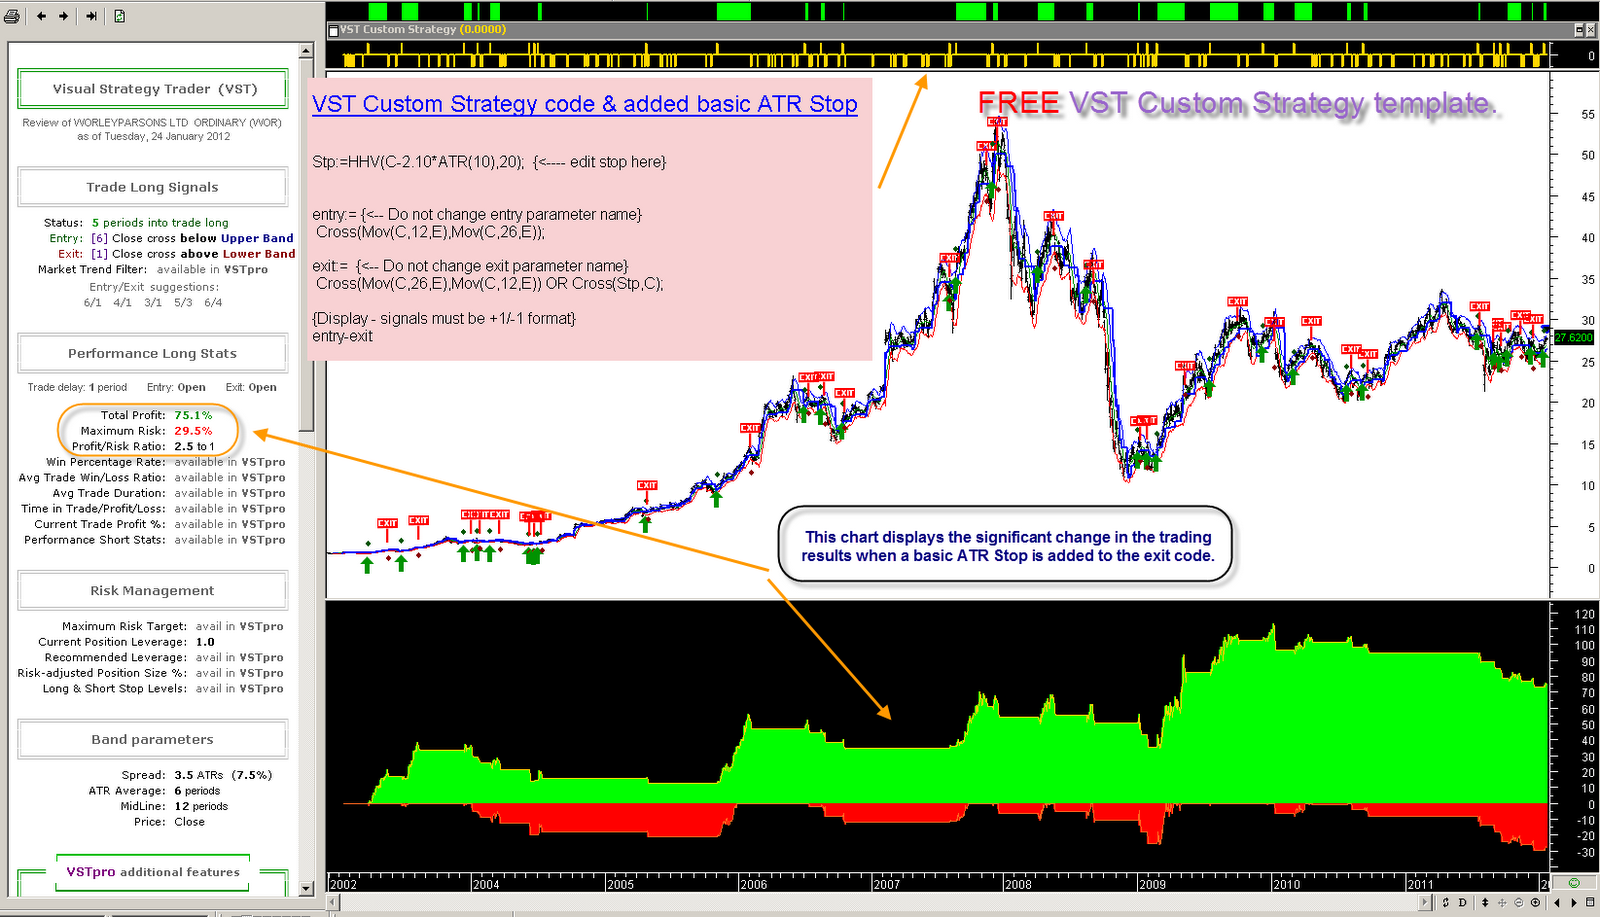
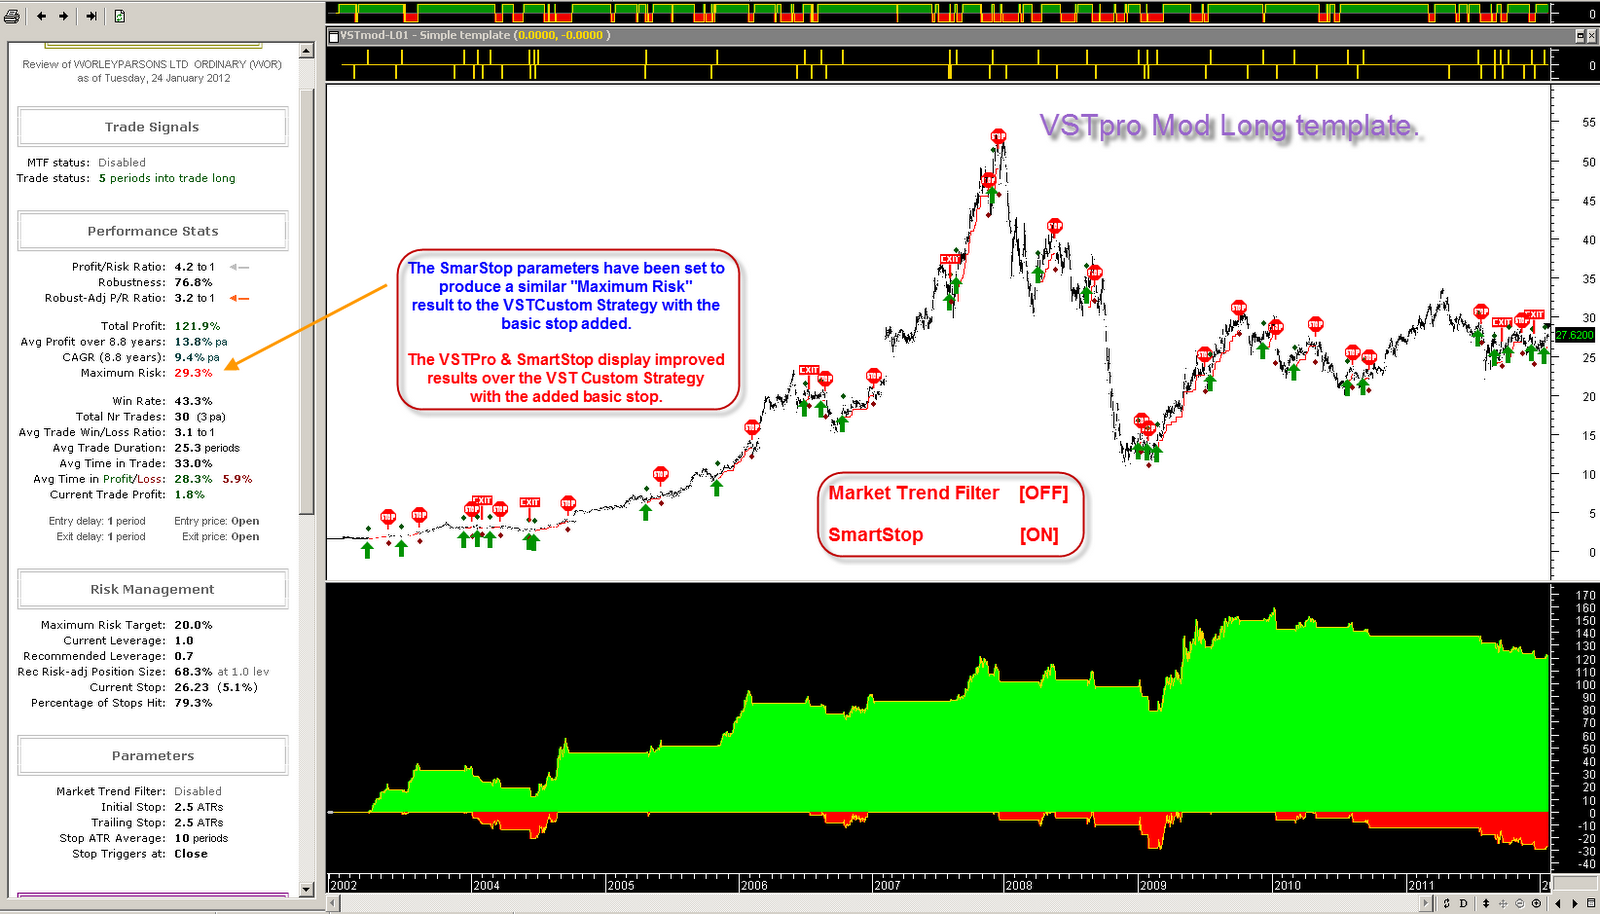
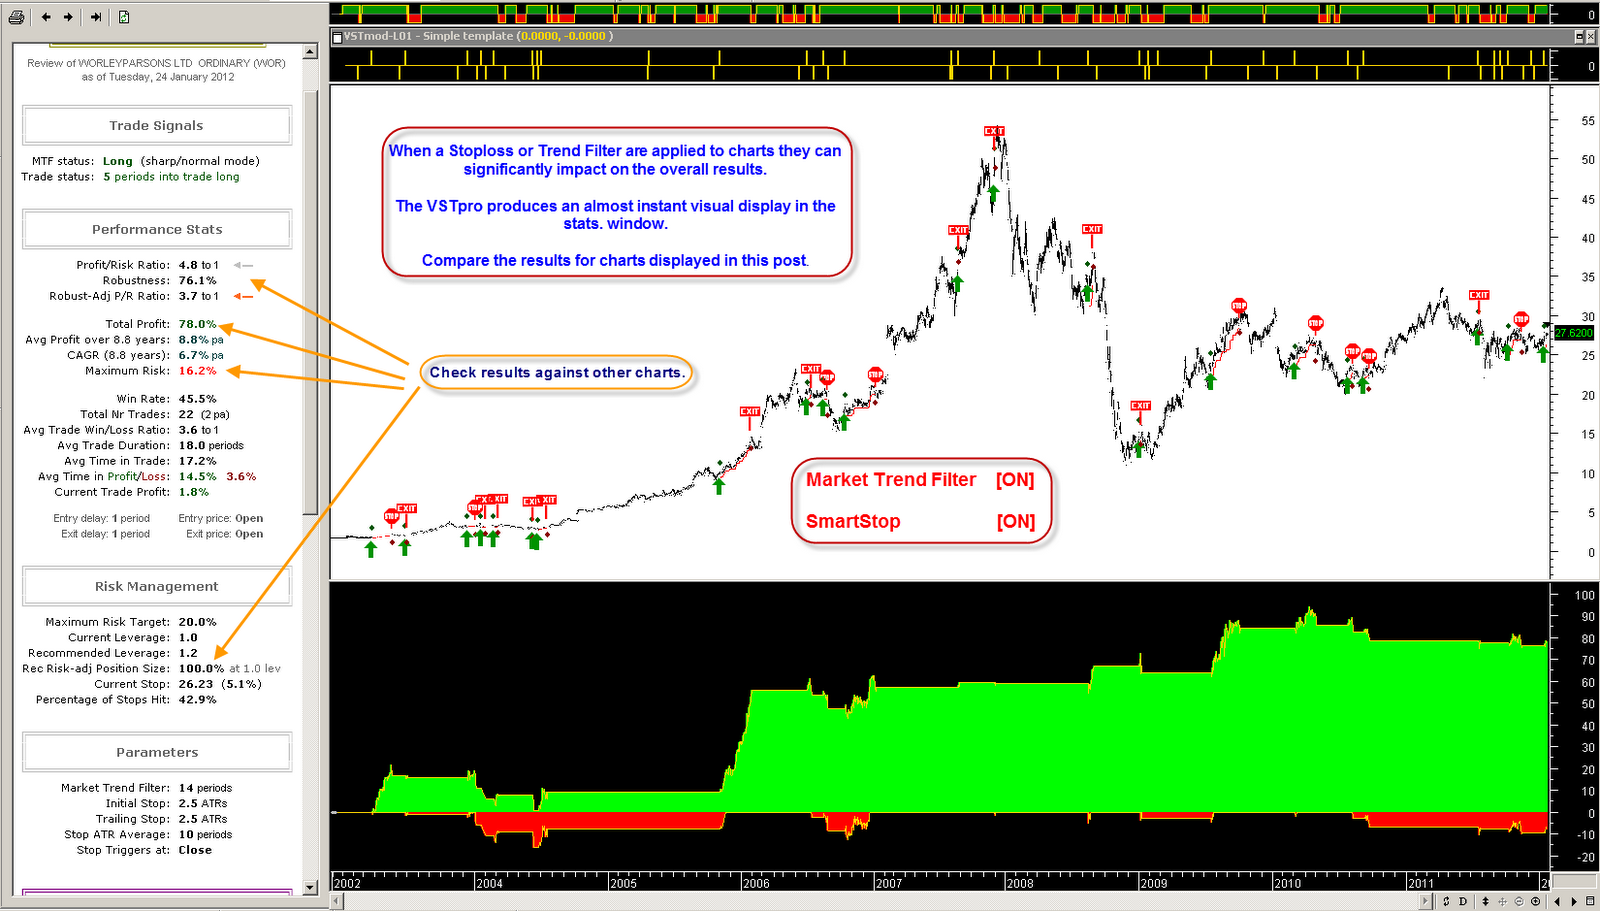
VST - Testing stoploss impact on trading results.

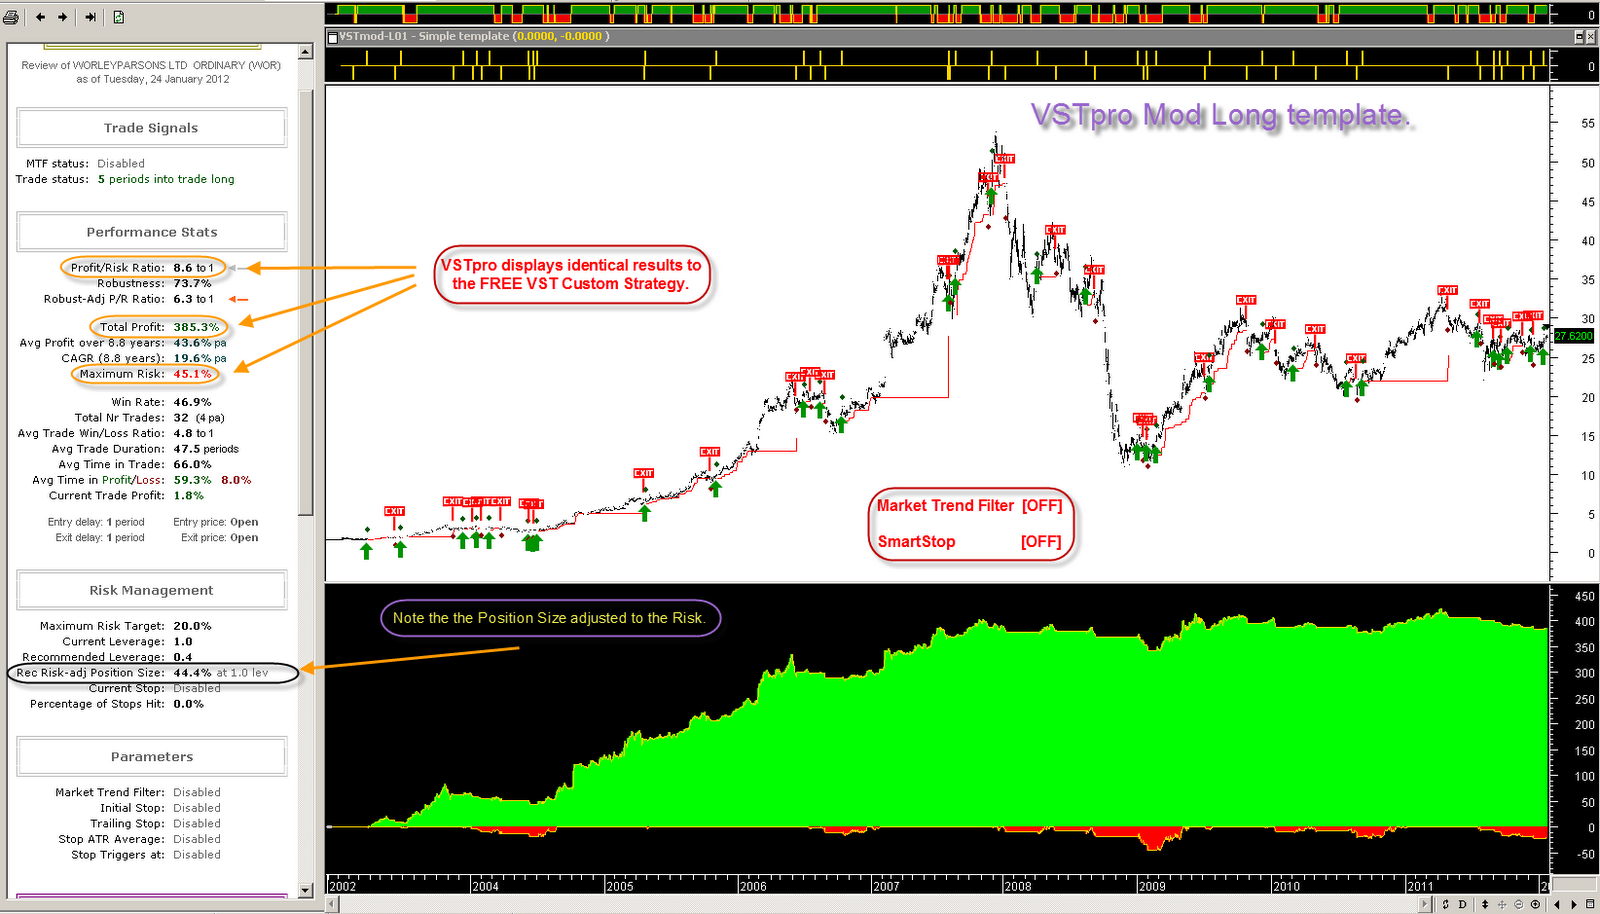
The charts below have been constructed using the FREE VST Custom Strategy and the VSTpro.

The stats. window displays the results for the different setups.


Click on the charts to enlarge.


Click on the charts to enlarge.


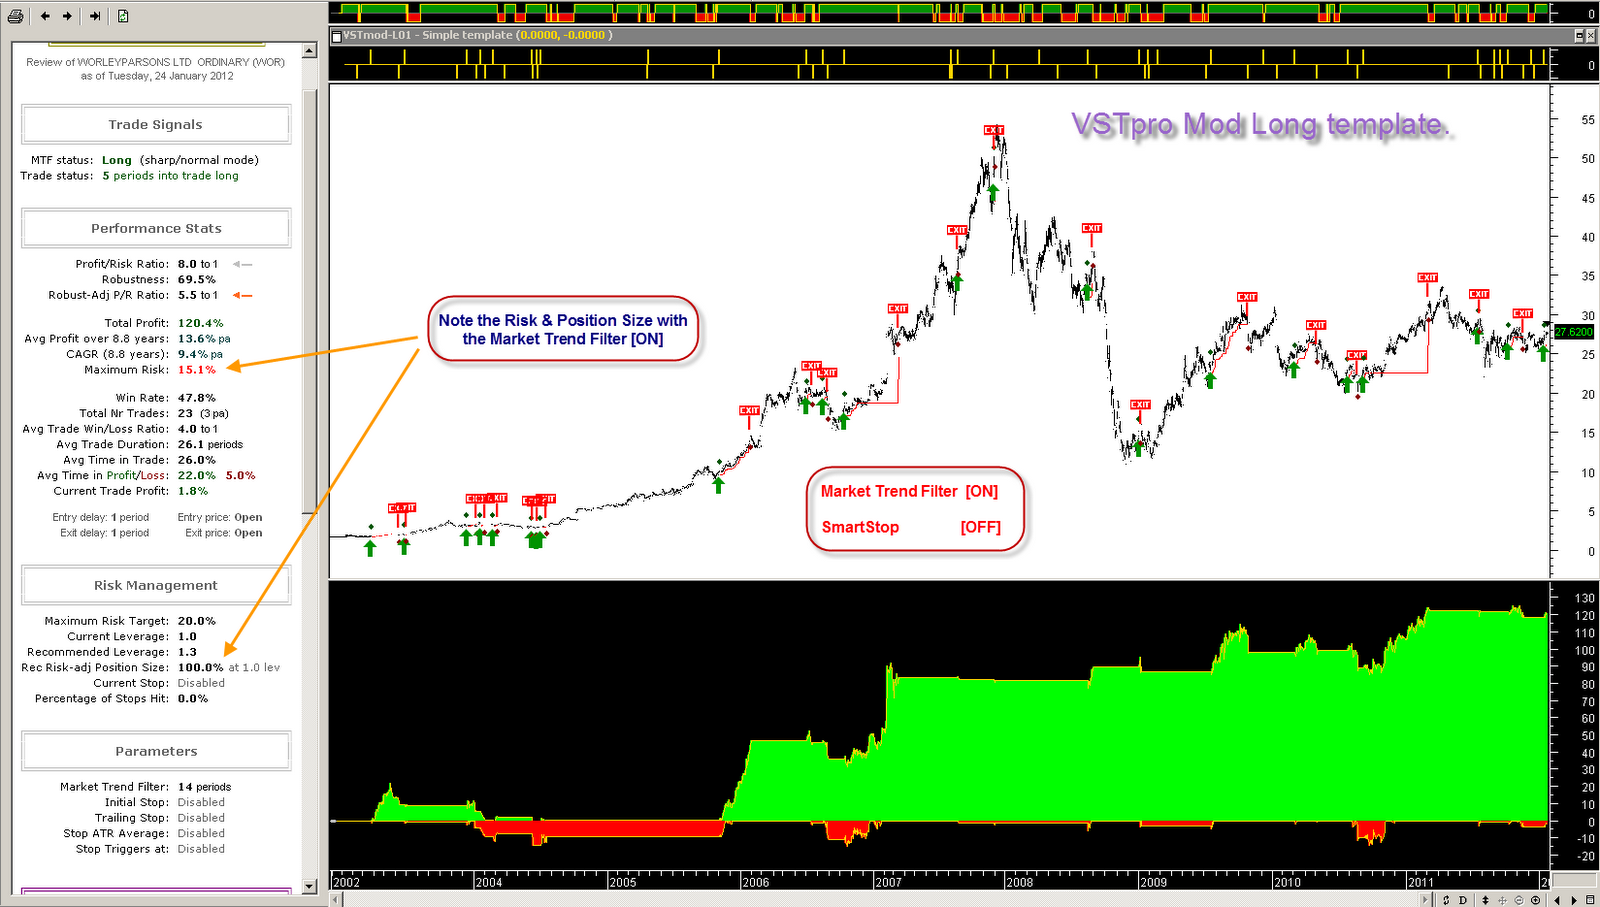
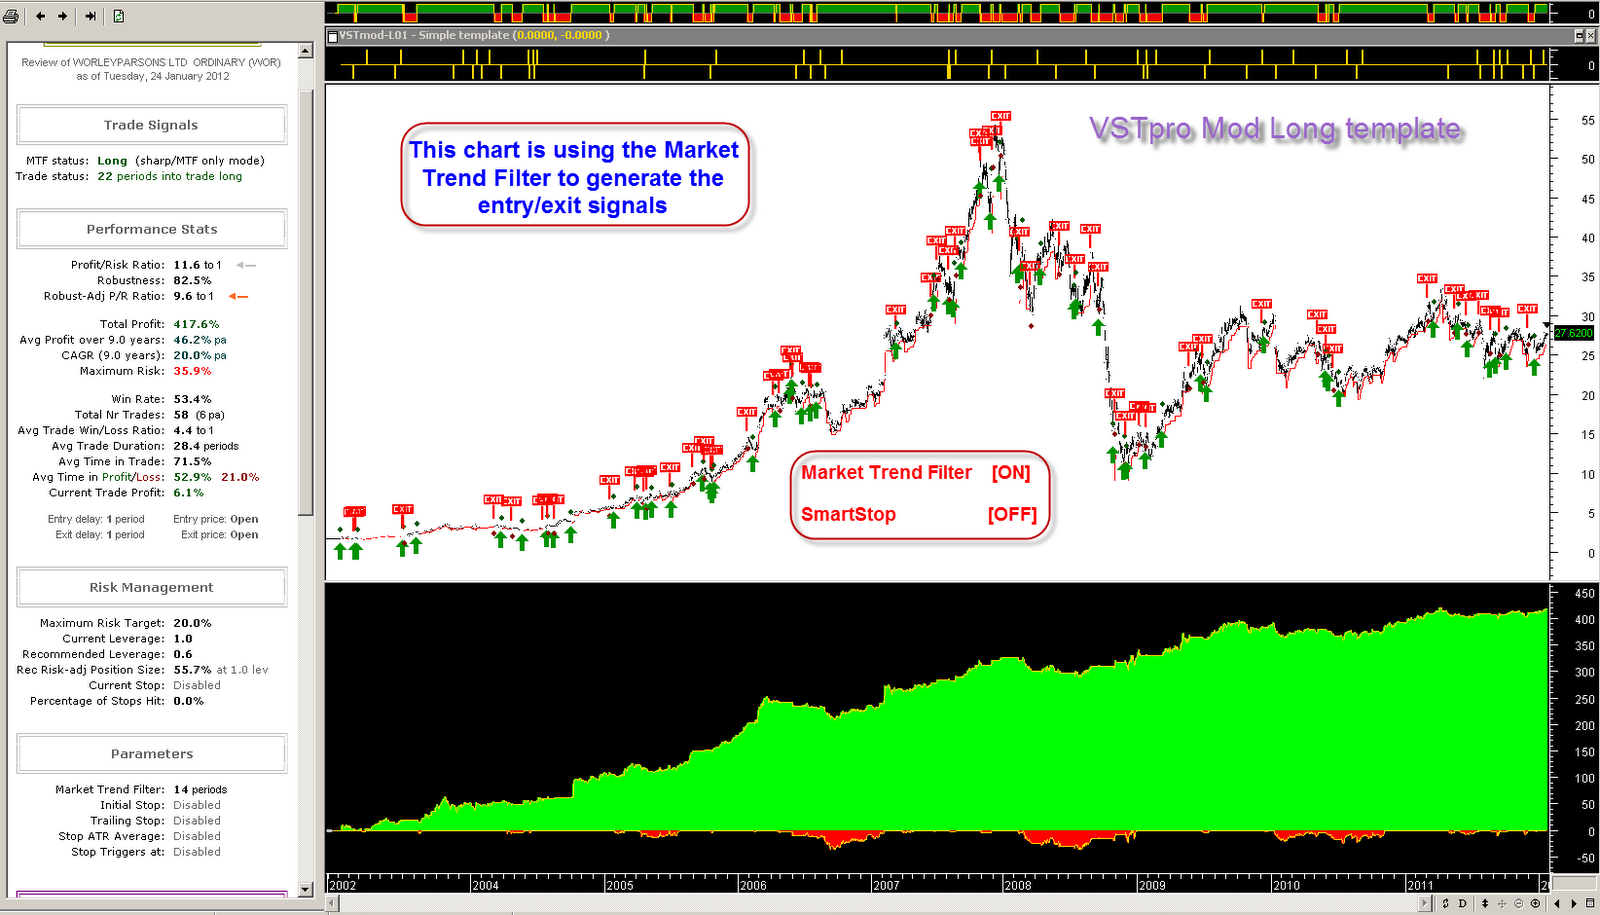
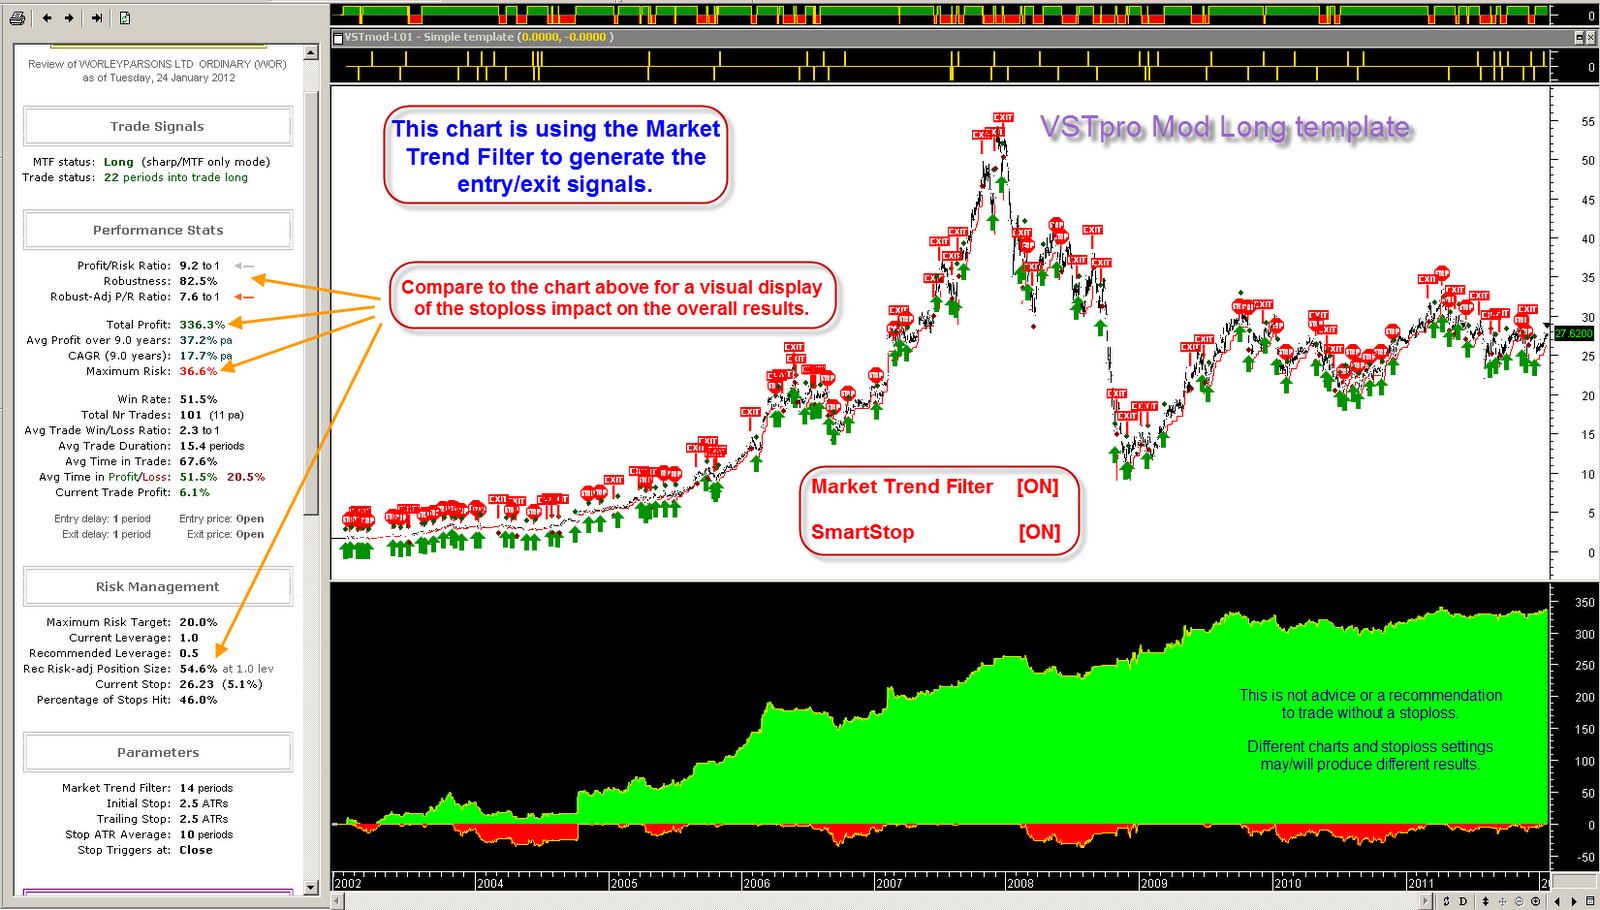
The charts below are setup to use the Market Trend Filter to generate the entry/exit signals.

The Market Trend Filter is over-riding the indicator entry/exit signals.

Click on chats to enlarge.

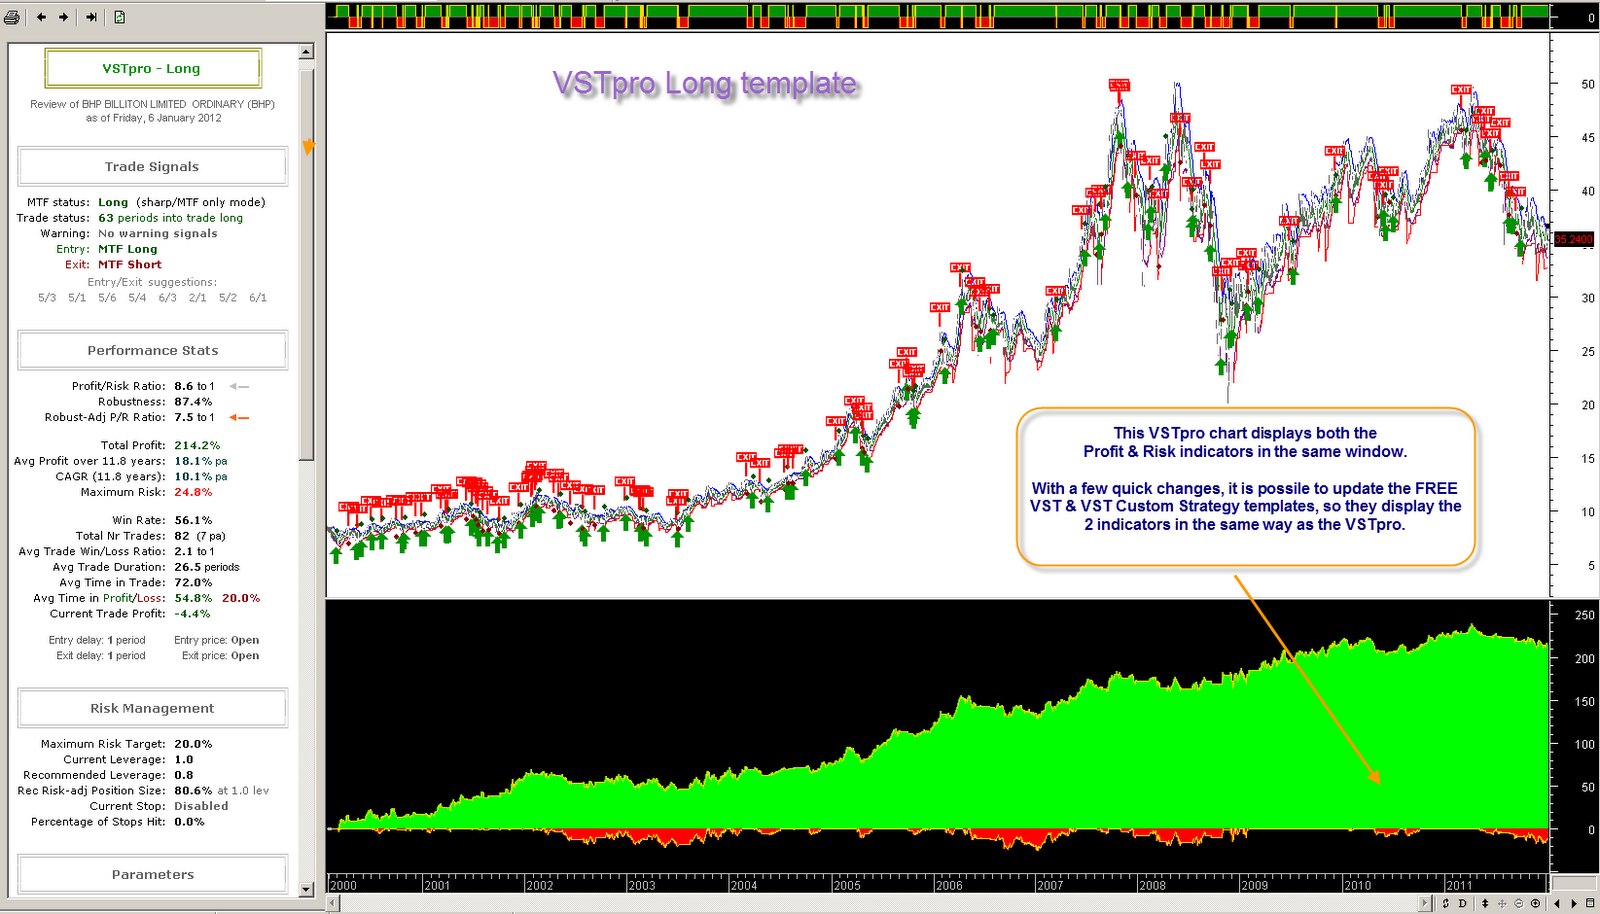
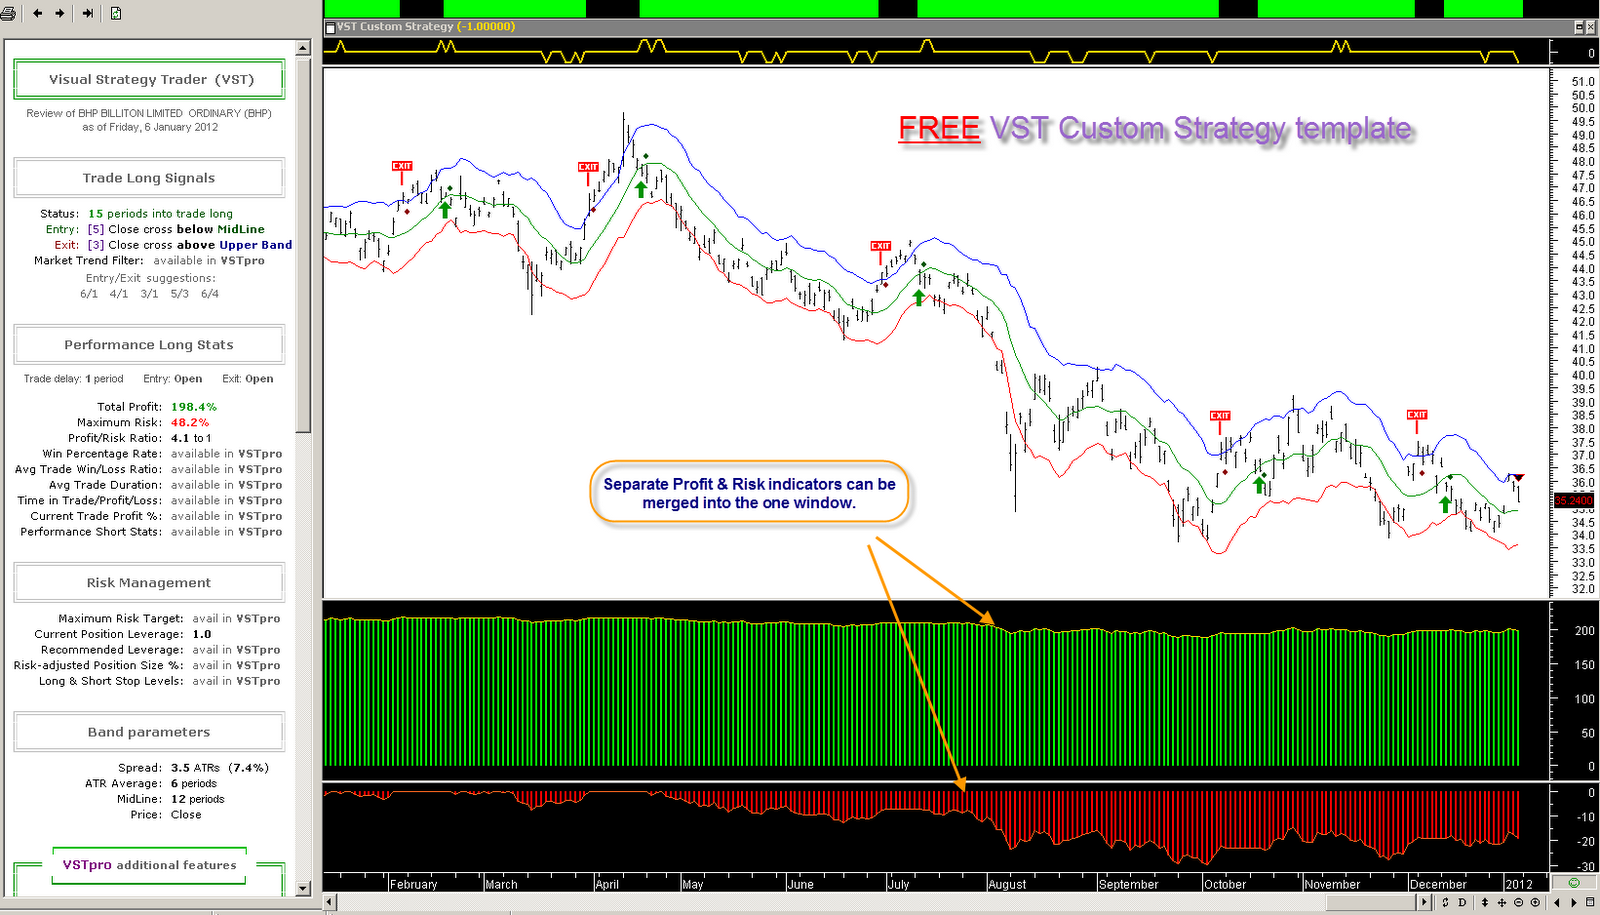
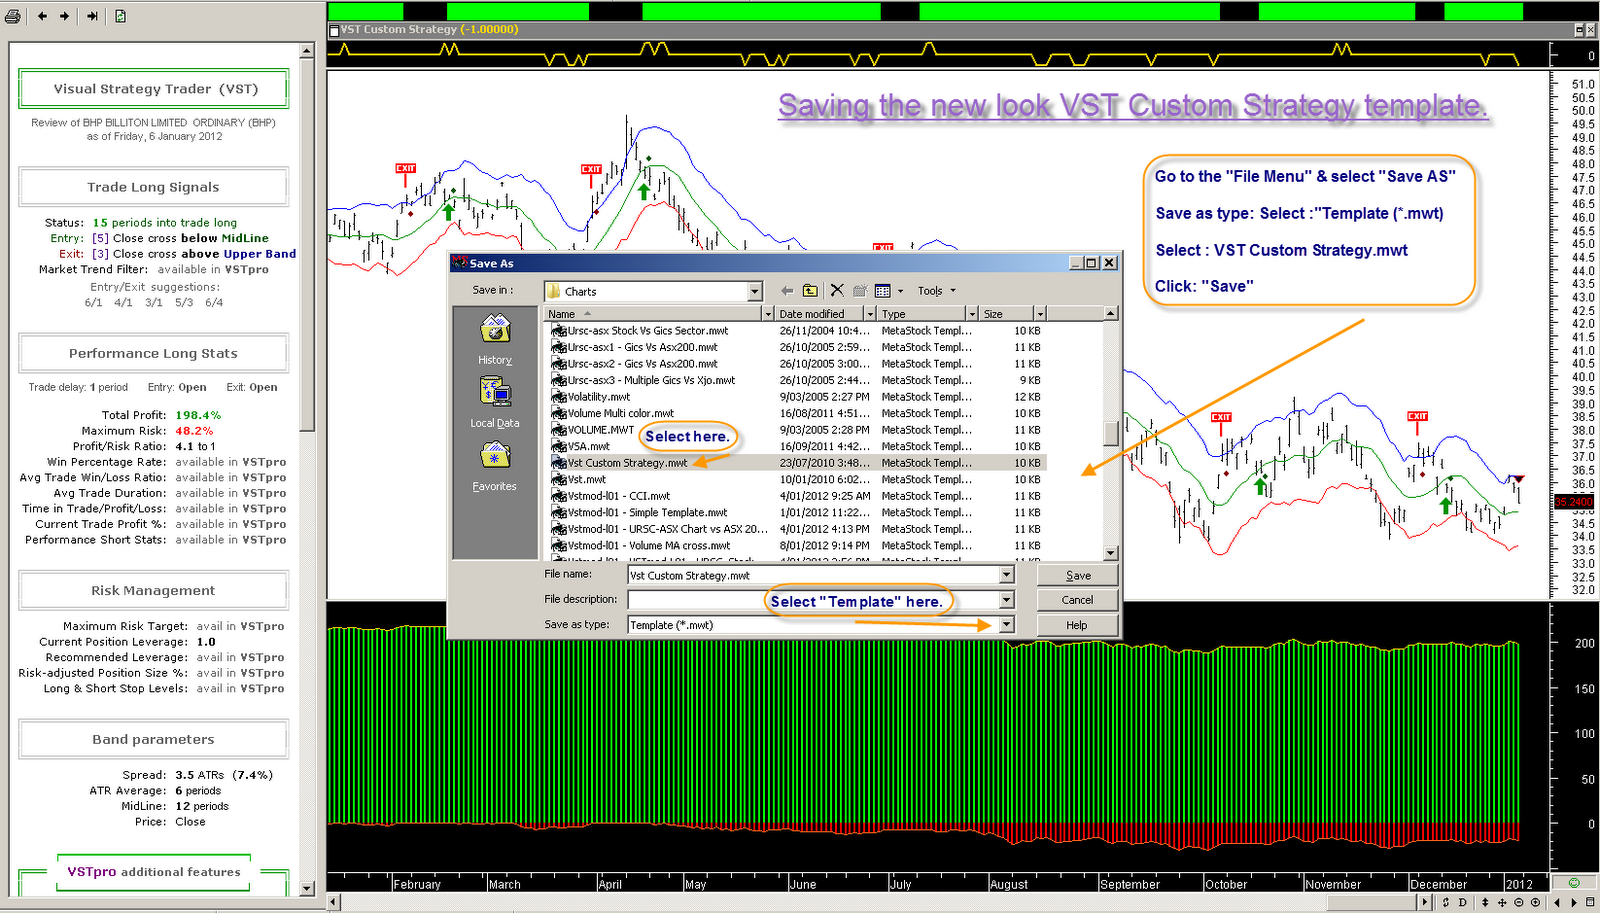
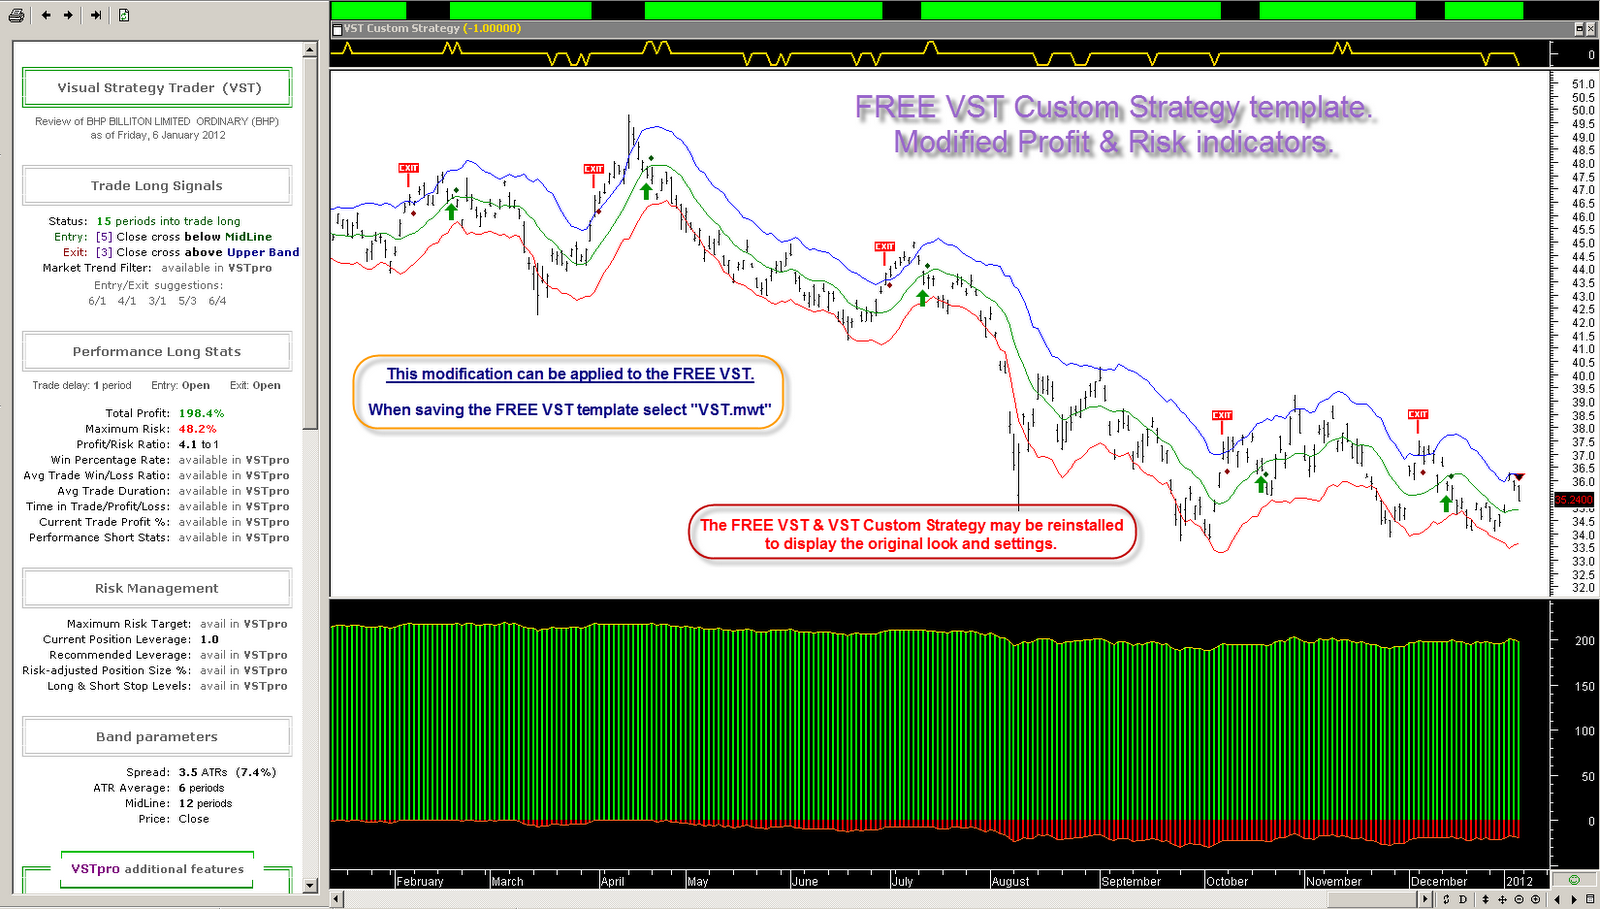
FREE VST & VST Custom Strategy - Profit & Risk indicator modification.

With a few quick steps the Profit and Risk indicators can be setup in the same window.

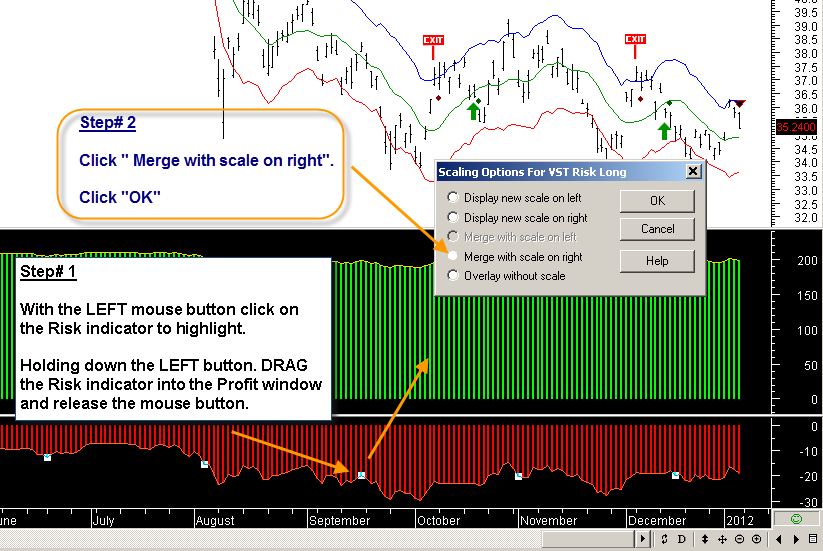
  • Highlight the Risk indicator.
  • Drag the Risk indicator in to the Profit window.
  • Merge with the scale on right.
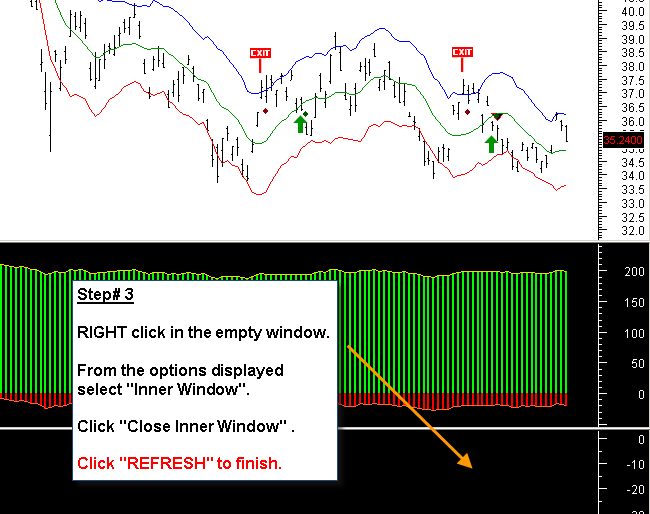
  • Delete the empty Risk indicator window.
  • To make the changes permanent "Save As" a template.
The charts below display the steps required to make the changes.

If at any stage problems arise the VST & Custom Strategy may be reinstalled.

The VST must be installed first, followed by the VST Custom Strategy.


Click on images to enlarge.


Click on images to enlarge.


Design Credit Best Blogger Tips | Best Blogger Templates | Best Social Icons