Ever wanted to "quick-test" an indicator or trading idea? Here's a way to get a fast "visual" in basic MetaStock, then quickly see how it measures up in both VSTfree and VSTpro.
It's a bit of work, but is quite re-usable. We'll create the following:
1. A custom Indicator, with "boilerplate" code to remove extra entry & exit signals.
2. An Expert with Highlights.
3, 4 & 5: Identical changes to the Indicators for VSTfree Custom Indicator, VSTmod L01 Indicator and VSTmod X Exploration.
At the end, we end up with four (4) charts, which can be saved as a group in a Layout.
1. First, create a new indicator and name it "_Test", then copy & paste the code below:
INDICATOR NAME: _Test
{ THIS IS THE "QUICKIE" PART -- AFTER SETUP, ADD ANYTHING YOU WANT TO TRY }
MAshort:=mov(C,5,S);
MAmedium:=mov(C,10,S);
MAlong:=mov(C,21,S);
Entry:=cross(MAshort,MAlong);
Exit:=cross(MAmedium,MAshort);
{ END "QUICKIE" }
{ REMOVE EXTRA SIGNALS, +1=Buy -1=Sell }
Signal:=Cum(IsDefined(entry+exit))=1; { Enough data ? }
Signal:=ValueWhen(1,entry-exit<>0 OR Signal,entry); { Current }
entry:=Signal*(Alert(Signal=0,2) OR entry*Cum(entry)=1); { Current or 1st }
exit:=(Signal=0)*(Alert(Signal,2) OR exit*Cum(exit)=1); { Current or 1st }
entry:=(exit=0)*entry; { favor EXIT }
Signal:=Entry-Exit; { Signal }
Season:=ValueWhen(1,Signal<>0,Entry)*2-1; { Signal active }
{ ---------------------- }
{ THIS PLOT IS "OPTIONAL" -- YOU COULD DISPLAY ANYTHING, OR NOTHING, HERE }
{ ---------------------- }
{ PLOT }
Signal;
{ *** END *** }
{ ---------------------- }
{ ALTERNATIVE PLOT -- Shows moving averages instead of entry & exit signals }
{ ---------------------- }
{ PLOT }
MAshort;
MAmedium;
MAlong;
{ *** END *** }
2. Open a chart of $SPX. Now, create an Expert and name it "_Test". On the HIGHLIGHTS tab, use the NEW button to create three sections, named BUY, SELL and DEFAULT. They should be in that order, from top-to-bottom.
BUY: FmlVar("_Test","Season")=+1; { Color=SEA GREEN }
SELL: FmlVar("_Test","Season")=-1; { Color=DARK RED }
DEFAULT: 1; { Color=YELLOW }
Make sure to click the ATTACH button. Modify the chart as follows:
- Double-click the Y-AXIS and check the box for "Semi-log scale".
- Double-click the X-AXIS and set "Margins/Right-Margin" to 40.
Your chart should look something like this:
Make sure to SAVE AS the chart under the name "QuickBASIC".
Note that this shows some promise, BUT we have no metrics. So, let's switch over to VSTfree & VSTpro. We're basically going to add the same two lines of code -- everywhere.
3. (VSTfree) In the
VST Custom Strategy Indicator, replace the current ENTRY and EXIT code with the following:
Entry:=FmlVar("_Test","Signal")=+1;
Exit:=FmlVar("_Test","Signal")=-1;
RIGHT-CLICK the chart, then LEFT-CLICK the APPLY TEMPLATE option; choose "Vst Custom Strategy.mwt" and hit ENTER. Now, let's modify this as follows:
Get rid of the upper and lower bands: Click the lower band (red) to select it, and change the color to WHITE. Same for the upper band (blue).
Next, double-click the middle band (green), and set the last item, STRATEGY, to 2 (Custom).
Refresh the chart.
Double-click the Y-AXIS and check the box for "Semi-log scale".
Double-click the X-AXIS and set "Margins/Right-Margin" to 40.
Your chart should look something like this:
The VSTfree chart can be cleaned up a bit, by dragging the bottom Indicator to the window above it, and merging the scales at right, then closing the bottom inner-window.
Make sure to SAVE the chart under the name "QuickFREE".
4. (VSTmod) In the
VSTmod-L01 - Simple template Indicator, replace the current ENTRY and EXIT code with the following:
Entry:=FmlVar("_Test","Signal")=+1;
Exit:=FmlVar("_Test","Signal")=-1;
RIGHT-CLICK the chart, then LEFT-CLICK the APPLY TEMPLATE option; choose "Vstmod-l01 - Simple Template.mwt" and hit ENTER. Modify the chart as follows:
- Double-click the MTF and set it to "4", NoMTF.
- Ensure stops are set to DISABLE.
- Refresh the chart.
- Double-click the Y-AXIS and check the box for "Semi-log scale".
- Double-click the X-AXIS and set "Margins/Right-Margin" to 40.
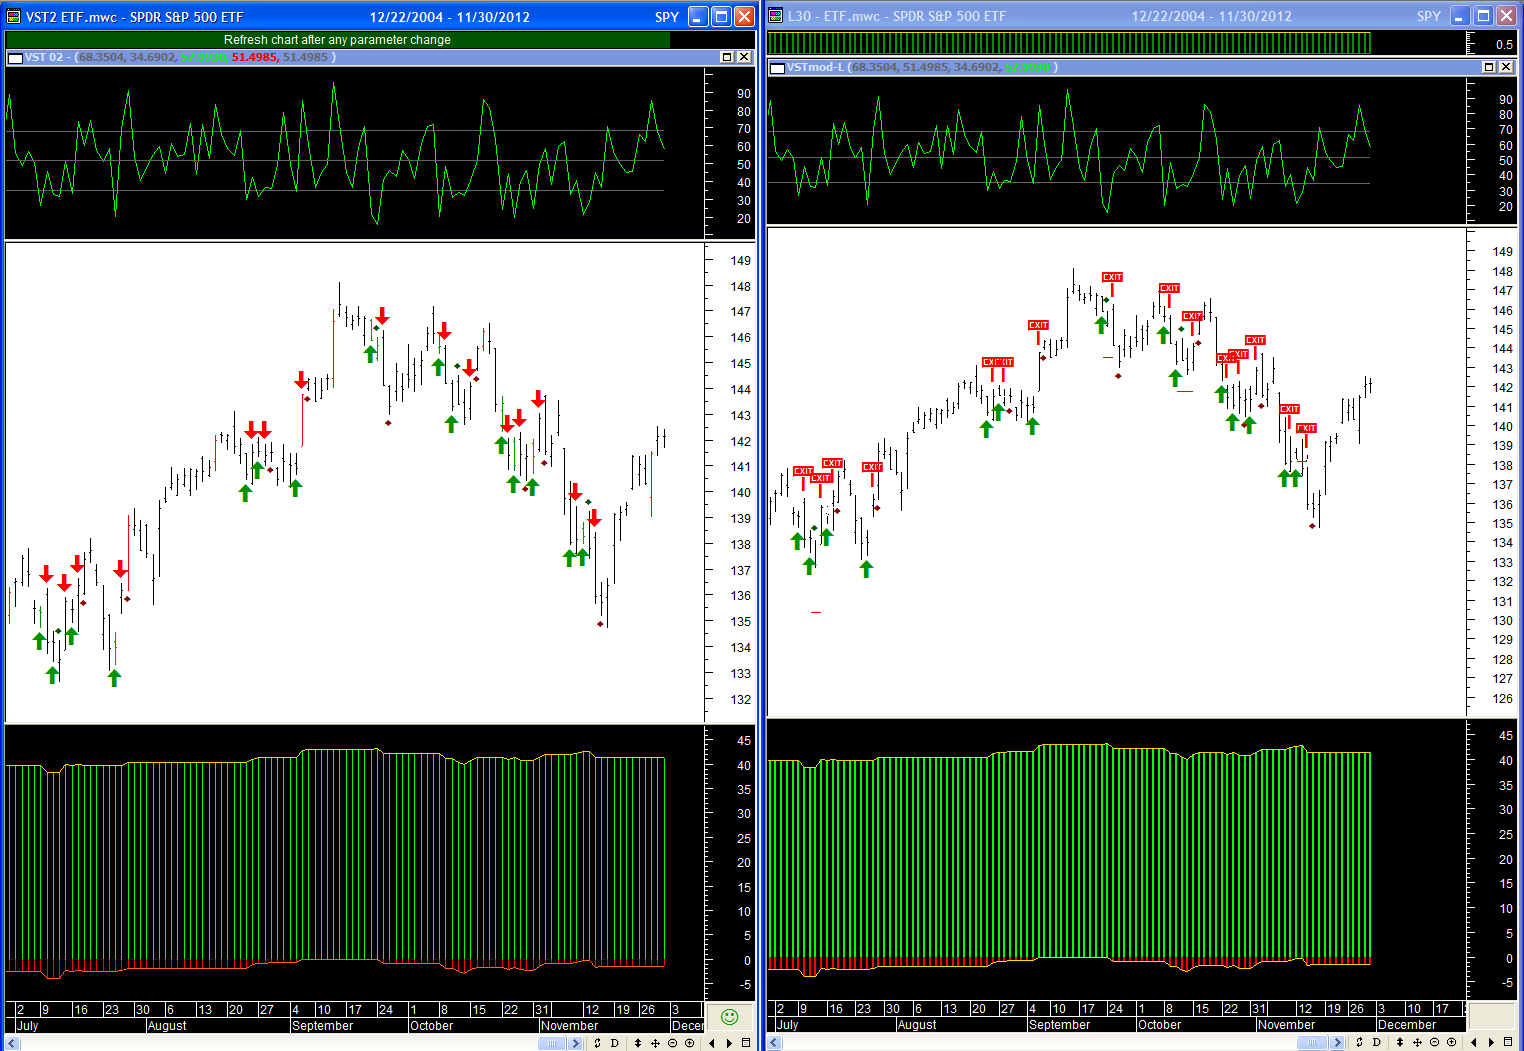
Your chart should look something like this:
Make sure to SAVE AS the chart under the name "QuickMOD".
5. (VSTmod) EXPLORATION -- In the
VSTmod X Long Custom Indicator, replace the current ENTRY and EXIT code with the following:
Entry:=FmlVar("_Test","Signal")=+1;
Exit:=FmlVar("_Test","Signal")=-1;
RIGHT-CLICK the chart, then LEFT-CLICK the APPLY TEMPLATE option;
choose "
Vstmod-long - Explorer.mwt" and hit ENTER. Modify the
chart as follows:
- Double-click the MTF and change the formula for MTF to "4", No MTF.
- Ensure stops are set to DISABLE.
- Refresh the chart.
- Double-click the Y-AXIS and check the box for "Semi-log scale".
- Double-click the X-AXIS and set "Margins/Right-Margin" to 40.
Your chart should look something like this:
Make sure to SAVE AS the chart under the name "QuickEXPLORE".
CREATE A LAYOUT
Anytime you want to test something new, put in in the "_TEST" Indicator, then open any of the charts you just created to see how it looks/performs. Or, you could create a layout, and see them all-at-once, instantly:
- Close all the charts.
- Reopen all four charts.
- Click the TILE button (or WINDOW -- TILE on the menu bar.)
To create the Layout file, click FILE -- NEW -- LAYOUT, click ADD ALL and OK, then save under the name QUICK.mwl.
NOTE: When switching to any of the VST charts, click the Refresh symbol on the toolbar, which will both select that chart and refresh it.
You can eliminate some visual "clutter" by turning off some items. Double-click a blank
area of each chart, select "Chart Window Properties" and turn off the following:
- "Show chart title bar"
- "Show inner window title bars"
- "Show inner window splitter bars"
NOTE: With titles off, you must use ALT-Minus, X to expand a chart to full-screen. Here is the de-cluttered version of the above:
Finally, here are the Commentary windows for the three VST Charts:
CONCLUSION
As you have no doubt noted by now, this particular formula doesn't measure up, either alone or with the MTF turned on. Next time, we'll try something else.


