
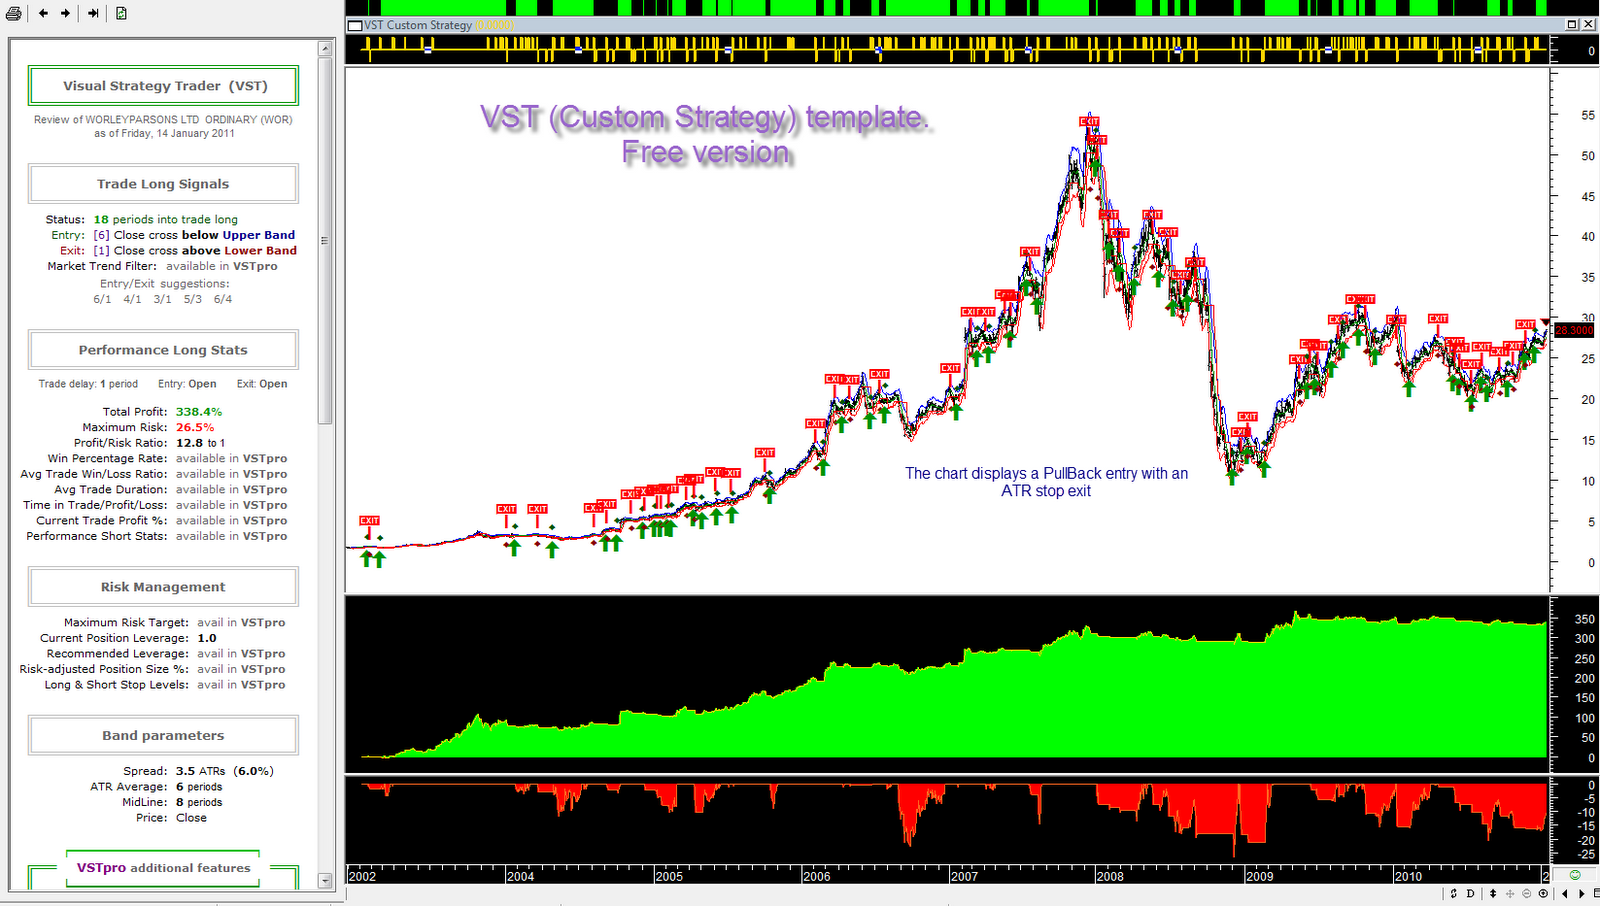
The VST (Custom Strategy), free version, is a powerful tool for testing entry/exits, and if by mistake the code fails to work, just re-install to the original settings.
The code is open, and this PullBack example the VST bands indicator has been modified to use the Mid band and an ATR stop.
Entry=Close cross below Mid band.
Exit=Close cross below ATR stop.
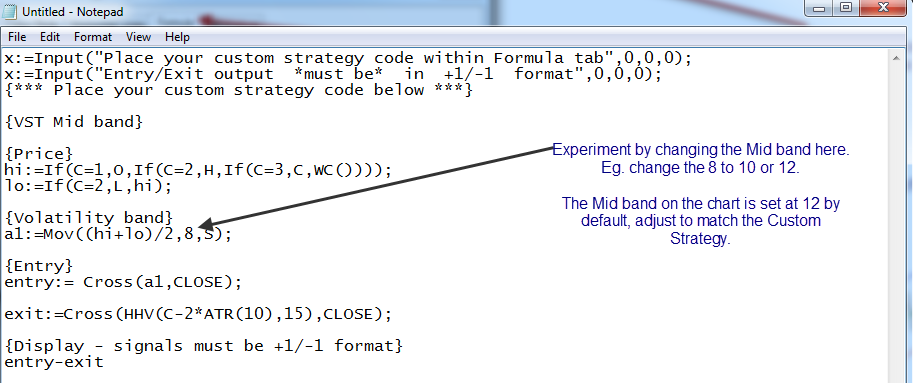
The Mid band is set to [8] and could be adjusted to 10 or 12 etc. (see image below)
Copy and paste the code, between the lines, into the VST Custom Strategy indicator.
This can be via the chart by opening the indicator as per the image below
or
By opening the indicator via the MetaStock Indicator Builder.
{-------------------------------copy below this line--------------------------------------}
x:=Input("Place your custom strategy code within Formula tab",0,0,0);
x:=Input("Entry/Exit output *must be* in +1/-1 format",0,0,0);
{*** Place your custom strategy code below ***}
{VST Mid band}
{Price}
hi:=If(C=1,O,If(C=2,H,If(C=3,C,WC())));
lo:=If(C=2,L,hi);
{Volatility band}
a1:=Mov((hi+lo)/2,8,S);
{Entry}
entry:= Cross(a1,CLOSE);
{Exit}
exit:=Cross(HHV(C-2*ATR(10),15),CLOSE);
{Display - signals must be +1/-1 format}
entry-exit
{----------------------------copy above this line--------------------------------}
The VST and VST (Custom Strategy) are free to download and use.(see top menu on blog page.)
 Click on images to enlarge.
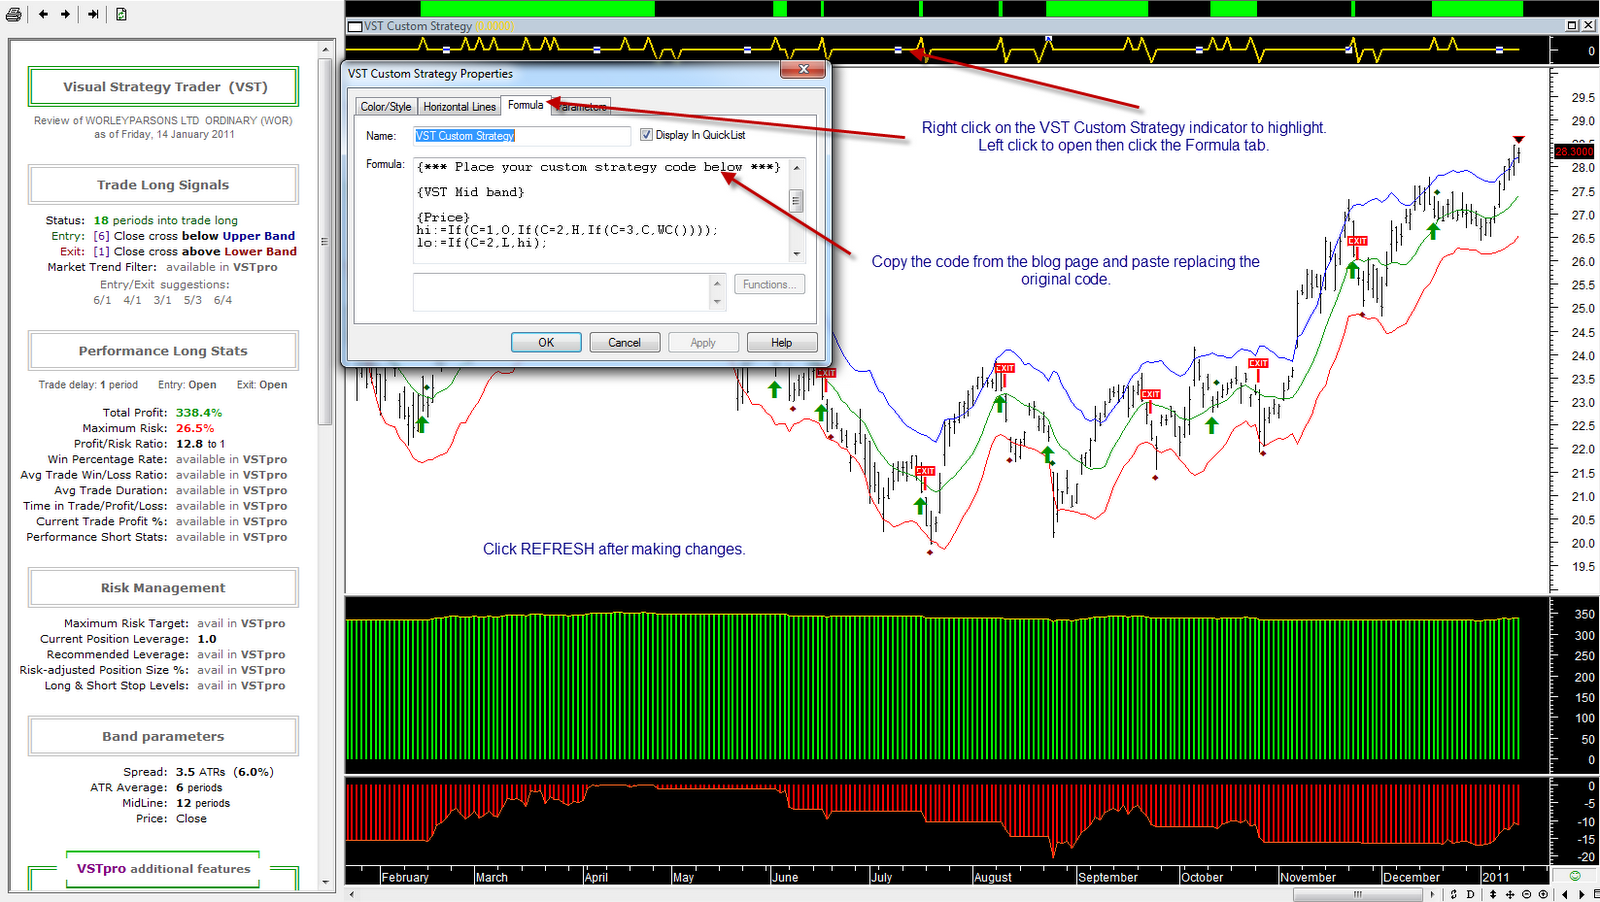


No comments:
Post a Comment