To view extra charts click here
Most weeks the blog will have a post called “Weekly Chart”.
The charts will be selected from the Australian ASX20.
Charts mostly have VSTPro templates applied with comments added.
Charts are selected in alphabetical order and for educational purposes only.
These are not recommendations to trade.
Note……………
Reading the results in the data window and comparing them to other charts can be
very useful.
Click on the link below the chart to view a slide show with extra charts.
Lunar Cycle indicator for MetaStock
See previous post for charts.
This indicator is free to download from Jose Silva @ metastocktools.com
Extra infomation about the indicator is available from metastocktools.com
MetaStock -> Tools -> Indicator Builder -> New
-> copy & paste complete formula below.
============
Lunar cycles
============
---8<-----------------------------------------
{Full/New/Q1/Q3 Moon signals indicator Mk XV.
Plots:
+1 signal on Full Moon; -1 on New Moon;
+0.5 on first Quarter; -0.5 on last Quarter.
Accurate to within 2 hours every 19 years.
Signals that fall on holidays or weekends
are plotted on the next trading day.
Use the signal advance input to view
approaching signals.
Adj lunar signals to market's local Time Zone
(generally add 1hr for Daylight Saving Time):
New Zealand: +12hrs
Australia: +10
Japan: +9
SE Asia: +8
Thai/Indonesia: +7
India: +5.5
Dubai: +4
Moscow: +3
Europe: +1
UK & Portugal: 0
USA, NY: -5
Chicago: -6
http://www.travel.com.hk/region/timezone.htm
Copyright © 2001-2009 Jose Silva.
The grant of this license is for personal use
only - no resale or repackaging allowed.
All code remains the property of Jose Silva.
http://www.metastocktools.com }
{ User inputs }
TZ:=Input("Market's local Time Zone? [-12hrs to +12hrs]",-12,12,-5);
shift:=Input("Advance signal by x calendar days",-30,30,0);
plot:=Input("Plot Q1 and Q3 (half) signals? [1]Yes, [0]No",0,1,0);
{ Lunar cycle length in days (synodic month) }
LunarMonth:=29.53059;
offset:=4.86;
{ Calendar engine }
y:=Year()-(Month()<3);
leap:=Int(y/4)-Int(y/100)+Int(y/400);
mth:=Int((2+153*(Month()-3+12*(Month()<3)))/5);
dayNr:=DayOfMonth()+mth+y*365+leap-657382
-offset-TZ/24+shift;
{ New/Q1/Full/Q3 Moon cycles }
NM:=Frac((DayNr+LunarMonth/2)/LunarMonth);
Q1:=Frac((DayNr+LunarMonth/4)/LunarMonth);
FM:=Frac(DayNr/LunarMonth);
Q3:=Frac((DayNr-LunarMonth/4)/LunarMonth);
{ Lunar cycle signals }
cycle:=FM-NM;
FM:=cycle<0>0,2);
NM:=-(cycle>0 AND Alert(cycle<0,2));
cycle:=Q1-Q3;
Q1:=(cycle<0>0,2))*.5;
Q3:=(cycle>0 AND Alert(cycle<0,2))*-.5;
signals:=If(plot=1,NM+Q1+FM+Q3,NM+FM);
{ Plot Lunar signals in own window }
signals
---8<-----------------------------------------
VSTPro-"Lunar Cycle" template ASX-XJO
Lunar Cycle charts click here.
The Aussie Stock Forums has a thread "Sheer Lunacy staring at the Heavens"
http://www.aussiestockforums.com/forums/showthread.php?t=20090
The thread is about a study using the Lunar Cycle to trade, and the PDF document can be viewed here. http://xa.yimg.com/kq/groups/17324418/945690453/name/RBS%2BMoon%2BPhase.pdf/
As the VSTPro has a "Lunar Cycle" template I decided to apply the it to the ASX-XJO and found the best entry/exit was Enter=FM / Exit=NM.
The LearnMetaStock.com website also has the "Lunar Cycle" template as an extra download for the VST. LearnMetaStock.com is a subscription service with many downloads and educational video presentations.
Weekly Chart
Click here to view ANZ charts.
Most weeks the blog will have a post called “Weekly Chart”.
The charts will be selected from the Australian ASX20.
Charts mostly have VSTPro templates applied with comments added.
Charts are selected in alphabetical order and for educational purposes only.
These are not recommendations to trade.
Note……………
Reading the results in the data window and comparing them to other charts can be
very useful.
Click on the link at the top of this post to view a slide show.
Weekly Chart
Ckick here to view AMP Charts
Most weeks the blog will have a post called “Weekly Chart”.
The charts will be selected from the Australian ASX20 with the first chart being AMP.
Charts mostly have VSTPro templates applied with comments added.
Charts are selected in alphabetical order and for educational purposes only.
These are not recommendations to trade.
Note……………
Reading the results in the data window and comparing them to other charts can be
very useful.
Click on the link at the top of this post to view a slide show.
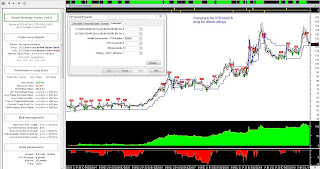
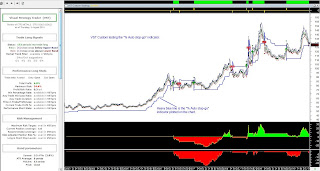
Breakout (Turtle) strategy for the VST Custom.
Click here to view video
The " Breakout " formula is at the end of this post. Copy/paste the formula into the " Custom Strategy" indicator.
The 2 charts below have been created using the VSTPro using an identical " Breakout " indicator.
Copy formula below this line............
--------------8--------------8-------------------
{VST Custom Strategy. Indicator must plot +1/-1.
Trade at own risk!
Enter your own indicator in the template below.}
x:=Input("Place your custom formula within Formula tab",0,0,0);
x:=Input("Entry/Exit output *must be* in +1/-1 format",0,0,0);
{*** Place your code below ***}
{ User inputs }
pds1:=21; {Enter Long breakout periods}
pds2:=10; {Enter Exit Long breakout periods}
{Best not to edit below this line
-----8-------------8---------------8}
x:=4; {"use Open=1 High=2 Low=3 Close=4 Volume=5 WC=6"}
;
delay:=0; {Input("Entry and Exit delay"}
plot:=1; {Input("Signals: [1]Clean, [2]All, [3]Trade binary"}
{ Select breakout price field }
x:=If(x=1,O,If(x=2,H,If(x=3,L,If(x=5,V,If(x=6,WC(),C)))));
{ Entry/Exit Long breakouts }
entry:=x>Ref(HHV(x,pds1),-1);
exit:=x0 OR init,long);
long:=flag*(Alert(flag=0,2) OR init);
short:=(flag=0)*(Alert(flag,2) OR init);
signals:=long-short;
{ Plot in own window }
Ref(If(plot=2,entry,0),-delay);
Ref(If(plot=1,signals,
If(plot=2,-exit,flag)),-delay)
Updated code for the % Stop
Below is updated code sent from Jose Silva @ metastocktools.com
As for the stop code, the formula below plots identically and faster (for explorations) with two of the seven PREV functions taken out:
---8<---------------------------------- perc:=Input("Trailing Loss %",0,100,14); loss:=C*perc/100; trail:= If(LLV(C,2)>PREV,Max(PREV,C-loss),
If(HHV(C,2)PREV,C-loss,C+loss)));
entry:=Cross(C,trail);
exit:=Cross(trail,C);
entry-exit
---8<---------------------------------- This formula is even faster with three PREV functions taken out: ---8<---------------------------------- {Input} perc:=Input("Trailing Loss %",0,100,14); {Stops} loss:=C*perc/100; stopLong:=If(CPREV,C+loss,Min(C+loss,PREV));
{Signals}
In:=Cross(C,Ref(stopShort,-1));
Out:=Cross(Ref(stopLong,-1),C);
Init:=Cum(In+Out>-1)=1;
InInit:=Cum(In)=1;
flag:=BarsSince(Init OR In)
< BarsSince(Init OR Out)+InInit;
signals:=(InInit AND Alert(InInit=0,2)
OR flag AND Alert(flag=0,2))
-(flag=0 AND Alert(flag,2));
{Display}
signals
---8<----------------------------------
As for the stop code, the formula below plots identically and faster (for explorations) with two of the seven PREV functions taken out:
---8<---------------------------------- perc:=Input("Trailing Loss %",0,100,14); loss:=C*perc/100; trail:= If(LLV(C,2)>PREV,Max(PREV,C-loss),
If(HHV(C,2)
entry:=Cross(C,trail);
exit:=Cross(trail,C);
entry-exit
---8<---------------------------------- This formula is even faster with three PREV functions taken out: ---8<---------------------------------- {Input} perc:=Input("Trailing Loss %",0,100,14); {Stops} loss:=C*perc/100; stopLong:=If(C
{Signals}
In:=Cross(C,Ref(stopShort,-1));
Out:=Cross(Ref(stopLong,-1),C);
Init:=Cum(In+Out>-1)=1;
InInit:=Cum(In)=1;
flag:=BarsSince(Init OR In)
< BarsSince(Init OR Out)+InInit;
signals:=(InInit AND Alert(InInit=0,2)
OR flag AND Alert(flag=0,2))
-(flag=0 AND Alert(flag,2));
{Display}
signals
---8<----------------------------------
Testing a % stop-go indicator with the VST Custom Strategy.
Recently I noticed a bookmarked web page, http://stocata.org/metastock/stop_trail_perc.html and decided to test the formula with the VST Custom Strategy. The website has several other MetaStock formula that could be tested with the VST.
As with many indicators they work fine when the chart is trending nicely up or down but perform poorly on choppy or sideways movement.
I needed to use this indicator with the VST and it will not plot +1/-1 so I used the Cross function in MetaStock to create the +1/-1 plot.
Copy and paste the % Stop indicator below into MetaStock using the Indicator Builder.
8888888888888888888888888888888888888888888888888888888888888888
{% Auto stop-go}
perc:=Input("Trailing Loss % :",0,100,14);
loss:=C*perc/100;
trail:=
If(C>PREV AND Ref(C,-1)>PREV,
Max(PREV,C-loss),
If(C
Trail
8888888888888888888888888888888888888888888888888888888888888888
Name the Indicator “ % Auto stop-go “
Plot the “ % Auto stop-go “ indicator in the chart window.
Copy/paste the code below into the “ VST Custom Strategy “ indicator.
8888888888888888888888888888888888888888888888888888888888888
{VST Custom Strategy}
{VST Custom formula entry/exit instructions.
Trade at own risk!
Enter your own formula in the template below.
The formula must plot a +1/-1 on any chart.
Entry/exit formula must end with a semicolon [;] }
entry:= {<- Do not change entry parameter name} {-------Place your entry formula below this line------} Cross(CLOSE,Fml("% Auto stop-go")); exit:= {<- Do not change exit parameter name} {-------Place your exit formula below this line-------} Cross(Fml("% Auto stop-go"),CLOSE); {-------Do not edid below this line------} entry-exit {<- Do not change } 88888888888888888888888888888888888888888888888888888888888 Always REFRESH the chart after any changes. I have purchased the VSTPro so I can now post both the VST Custom and Pro charts.
VST Custom entry/exit signal testing..
The VST Custom indicator requires the input to be +1/-1.
A MetaStock user may be unsure about the way a formula or indicator will plot and an easy way to test for the +1/-1 plot is to enter the code into a simple indicator and plot on any open chart.
If the user has several formula to test an easy system is to have your code for testing entered into Windows Notepad. Copy/paste from Notepad to MetaStock.
Using one of the indicators on this post enter it into MetaStock using the Indicator Builder.
Copy/paste from this post and name it [ VST Custom-01-entry/exit indicator tester ]
Open the "VST Custom-01-entry/exit indicator tester" on any chart and then....
Right click on the indicator within the window to highlight it then left click. This will open up the properties window.
Click on the formula tab to display the formula and paste the next formula to test over the top of the original code.
Click OK at the bottom of the window and the new formula will now be displayed in the window.
Repeat the steps above, as required, until all formula are tested.
********************************************************************
{VST Custom formula entry/exit or indicator +1/-1 tester.
Trade at own risk!
Enter your own formula or indicator in the template below.}
x:=Input("Place your custom formula within Formula tab",0,0,0);
x:=Input("Entry/Exit output *must be* in +1/-1 format",0,0,0);
{*** Place your code below ***}
pds1:=21; {HHV (long) breakout periods}
pds2:=10; {LLV (short) breakout periods}
x:=4; {use Open=1 High=2 Low=3 Close=4 Vol=5}
x:=If(x=1,O,If(x=2,H,If(x=3,L,If(x=5,V,C))));
entry:=x>Ref(HHV(x,pds1),-1);
exit:=x Mov(C,40,E) AND HHVBars(H,70)=0;
***********************************************************************
The indicator below can be used as a temlpate to enter separate entry/exit formula.
The formula entered is for demonstration only.
***********************************************************************
{VST Custom formula entry/exit instructions.
Trade at own risk!
Enter your own formula in the template below.
The formula must plot a [1] on any chart.
Entry/exit formula must end with a semicolon [;] }
x:=Input("Place your custom formula within Formula tab",0,0,0);
x:=Input("Entry/Exit output *must be* in +1/-1 format",0,0,0);
entry:= {<- Do not change entry parameter name}
{--------------Place your entry formula below this line------------}
BarsSince(Cross(2,RSI(2))=1)=6;
exit:= {<- Do not change exit parameter name}
{--------------Place your exit formula below this line-------------}
Cross(Ref(Mov(L,180,E),-1),C);
entry-exit {<- Do not change }
Subscribe to:
Posts (Atom)