PREVIEW: VST 02, a new add-on for the free version of VST!

Due for release before year-end, VST 02 borrows "RSI Price/Vol composite" from VSTpro, with a unique Template and customized Expert which displays Long or Short in the same Chart!

Here is a comparison of the two, on the SPY:


And here are the Expert Commentaries:


While the Pro version gives a great deal more information, the two strategies deliver the same results.  Since the Expert is customized for the Price/Volume RSI Indicator, it displays Indicator information in the Commentary.  In VSTpro, you would have to double-click the Indicator to see this.


An interesting feature of the new add-on is that the same Chart can do both Long and Short.  In VSTpro, separate templates must be applied (although two Charts can share a combined Profit/Risk indicator).

TECHNICAL NOTE

After downloading VST-02setup.exe on an XP system with SP3, I did have to right-click the file, left-click Properties, and on the 2nd tab, set Compatibility to "Windows 98/Windows Me".

The "Quickie"

Ever wanted to "quick-test" an indicator or trading idea?  Here's a way to get a fast "visual" in basic MetaStock, then quickly see how it measures up in both VSTfree and VSTpro.

It's a bit of work, but is quite re-usable.  We'll create the following:

1.  A custom Indicator, with "boilerplate" code to remove extra entry & exit signals.

2.  An Expert with Highlights.

3, 4 & 5:  Identical changes to the Indicators for VSTfree Custom Indicator, VSTmod L01 Indicator and VSTmod X Exploration.
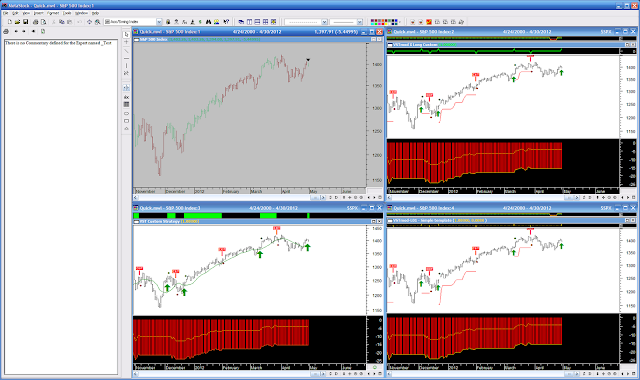
At the end, we end up with four (4) charts, which can be saved as a group in a Layout.


1.  First, create a new indicator and name it "_Test", then copy & paste the code below:

INDICATOR NAME:  _Test

{ THIS IS THE "QUICKIE" PART -- AFTER SETUP, ADD ANYTHING YOU WANT TO TRY }
MAshort:=mov(C,5,S);
MAmedium:=mov(C,10,S);
MAlong:=mov(C,21,S);

Entry:=cross(MAshort,MAlong);
Exit:=cross(MAmedium,MAshort);
{ END "QUICKIE" }

{ REMOVE EXTRA SIGNALS, +1=Buy -1=Sell }
Signal:=Cum(IsDefined(entry+exit))=1;                     { Enough data ? }
Signal:=ValueWhen(1,entry-exit<>0 OR Signal,entry);       { Current }
entry:=Signal*(Alert(Signal=0,2) OR entry*Cum(entry)=1);  { Current or 1st }
exit:=(Signal=0)*(Alert(Signal,2) OR exit*Cum(exit)=1);   { Current or 1st }
entry:=(exit=0)*entry;                                    { favor EXIT }
Signal:=Entry-Exit;                                       { Signal }
Season:=ValueWhen(1,Signal<>0,Entry)*2-1;                 { Signal active }


{ ---------------------- }
{ THIS PLOT IS "OPTIONAL" -- YOU COULD DISPLAY ANYTHING, OR NOTHING, HERE }
{ ---------------------- }
{ PLOT }
Signal;
{ *** END *** }


{ ---------------------- }
{ ALTERNATIVE PLOT -- Shows moving averages instead of entry & exit signals }
{ ---------------------- }
{ PLOT }
MAshort;
MAmedium;
MAlong;
{ *** END *** }


2.  Open a chart of $SPX.  Now, create an Expert and name it "_Test".  On the HIGHLIGHTS tab, use the NEW button to create three sections, named BUY, SELL and DEFAULT.  They should be in that order, from top-to-bottom.

    BUY:  FmlVar("_Test","Season")=+1;   { Color=SEA GREEN }
   SELL:  FmlVar("_Test","Season")=-1;   { Color=DARK RED }
DEFAULT:  1;                             { Color=YELLOW }


Make sure to click the ATTACH button.  Modify the chart as follows:

  • Double-click the Y-AXIS and check the box for "Semi-log scale".
  • Double-click the X-AXIS and set "Margins/Right-Margin" to 40.
Your chart should look something like this:


Make sure to SAVE AS the chart under the name "QuickBASIC".


Note that this shows some promise, BUT we have no metrics.  So, let's switch over to VSTfree & VSTpro.  We're basically going to add the same two lines of code -- everywhere.


3.  (VSTfree) In the VST Custom Strategy Indicator, replace the current ENTRY and EXIT code with the following:

Entry:=FmlVar("_Test","Signal")=+1;
Exit:=FmlVar("_Test","Signal")=-1;


RIGHT-CLICK the chart, then LEFT-CLICK the APPLY TEMPLATE option; choose "Vst Custom Strategy.mwt" and hit ENTER.  Now, let's modify this as follows:

  • Get rid of the upper and lower bands:  Click the lower band (red) to select it, and change the color to WHITE.  Same for the upper band (blue).
  • Next, double-click the middle band (green), and set the last item, STRATEGY, to 2 (Custom).
  • Refresh the chart.
  • Double-click the Y-AXIS and check the box for "Semi-log scale".
  • Double-click the X-AXIS and set "Margins/Right-Margin" to 40.
 Your chart should look something like this:

The VSTfree chart can be cleaned up a bit, by dragging the bottom Indicator to the window above it, and merging the scales at right, then closing the bottom inner-window.

Make sure to SAVE the chart under the name "QuickFREE".


4.  (VSTmod) In the VSTmod-L01 - Simple template Indicator, replace the current ENTRY and EXIT code with the following:

Entry:=FmlVar("_Test","Signal")=+1;
Exit:=FmlVar("_Test","Signal")=-1;

RIGHT-CLICK the chart, then LEFT-CLICK the APPLY TEMPLATE option; choose "Vstmod-l01 - Simple Template.mwt" and hit ENTER.  Modify the chart as follows:

  • Double-click the MTF and set it to "4", NoMTF.
  • Ensure stops are set to DISABLE.
  • Refresh the chart.
  • Double-click the Y-AXIS and check the box for "Semi-log scale".
  • Double-click the X-AXIS and set "Margins/Right-Margin" to 40.

Your chart should look something like this:


Make sure to SAVE AS the chart under the name "QuickMOD".


5.  (VSTmod) EXPLORATION -- In the VSTmod X Long Custom Indicator, replace the current ENTRY and EXIT code with the following:

Entry:=FmlVar("_Test","Signal")=+1;
Exit:=FmlVar("_Test","Signal")=-1;


RIGHT-CLICK the chart, then LEFT-CLICK the APPLY TEMPLATE option; choose "Vstmod-long - Explorer.mwt" and hit ENTER.  Modify the chart as follows:

  • Double-click the MTF and change the formula for MTF to "4", No MTF.
  • Ensure stops are set to DISABLE.
  • Refresh the chart.
  • Double-click the Y-AXIS and check the box for "Semi-log scale".
  • Double-click the X-AXIS and set "Margins/Right-Margin" to 40.

Your chart should look something like this:


Make sure to SAVE AS the chart under the name "QuickEXPLORE".


CREATE A LAYOUT

Anytime you want to test something new, put in in the "_TEST" Indicator, then open any of the charts you just created to see how it looks/performs.  Or, you could create a layout, and see them all-at-once, instantly:

  • Close all the charts.
  • Reopen all four charts.
  • Click the TILE button (or WINDOW -- TILE on the menu bar.)

To create the Layout file, click FILE -- NEW -- LAYOUT, click ADD ALL and OK, then save under the name QUICK.mwl.
 
NOTE:  When switching to any of the VST charts, click the Refresh symbol on the toolbar, which will both select that chart and refresh it.


You can eliminate some visual "clutter" by turning off some items.  Double-click a blank area of each chart, select "Chart Window Properties" and turn off the following:

  • "Show chart title bar"
  • "Show inner window title bars"
  • "Show inner window splitter bars"

NOTE:  With titles off, you must use ALT-Minus, X to expand a chart to full-screen.  Here is the de-cluttered version of the above:


 Finally, here are the Commentary windows for the three VST Charts:


CONCLUSION

As you have no doubt noted by now, this particular formula doesn't measure up, either alone or with the MTF turned on.  Next time, we'll try something else.

Filling in for David: Your suggestions for topics wanted!

David is on hiatus, and has asked me to cover the blog for awhile.  While I am learning my way around Blogger, the comments will be open, so you can post suggestions for topics to cover.  Also, it would helpful to get an idea of what level of MetaStock user you are -- light, medium or heavy.

1.  Are you familiar and comfortable with the interaction of Indicators, Experts, and Explorations?

2.  Have you used the FML(), FMLVAR() and EXTFML() functions?

3.  Do you use Excel for analysis of Exploration results?

4.  Is there a specific indicator, chart or other area in which you are interested?

Back soon,


--Johnathan

VSTpro Market Trend Filter (sharp v traditional mode) Part 2

This example uses the same stock as the previous post, ASX (ALS).

The system is a simple moving average cross over that has been optimized, and 10/40 produce the best results on (ALS).

(10 day simple moving average crossing 40 day simple moving average)

The display and stats indicate a MA cross over system can perform well in trending markets with the addition of a trend filter.

NOTE: This is a very basic system, and and only simple moving averages were used for the optimization.


VSTpro Market Trend Filter (sharp v traditional mode)

Several weeks back, while running a MetaStock exploration to find stocks making 'New Highs' on the ASX, ALESCO CORPORATION ORDINARY (ALS) was one of the stocks making new 3 month highs. ( The exploration is for short term 'New Highs')

On completion of the exploration the results are viewed using a VSTpro template, the parameters can be altered, and the resulting changes viewed in the stats window.

The charts below display the results after changing the Market Trend Filter from (sharp to traditional mode).

The (traditional mode) is more conservative compared to the (sharp mode).

A full MTF explanation can be found in the VSTpro manual here.

A sample of the 30/03/2012 exploration results can be viewed below.


VSTpro 2010/2011/2012 sample trade results. (US stocks)

Click on links below.

2010 | 2011 | Details | Disclaimer


MetaStock Training-Live-Webinar-Learn-Classes-click here

GICS Indices vs ASX 200 30/3/2012

Click on image to enlarge.

Banks vs ASX 200 30/3/2012

Click on image to enlarge.

VSTpro 2010/2011/2012 sample trade results. (US stocks)

Click on links below.

2010 | 2011 | Details | Disclaimer

GICS Indices vs ASX 200 23/3/2012

Click on image to enlarge.

MetaStock Training-Live-Webinar-Learn-Classes-click here

Banks vs ASX 200 23/3/2012

Click on image to enlarge.

MetaStock Training-Live-Webinar-Learn-Classes-click here

Adding the MAR Ratio to the VSTpro stats.

The VSTpro is open coded, and this allows the user to add or change features.

Not all changes are possible, but some can be made e.g. adding the MAR ratio to the stats.

Google ' MAR Ratio ' for a detailed description.

Adding the new stats required a short line of code placed into the main templates, taking only a few minutes.

The FREE VST and VSTpro platforms give a visual display combining chart + indicator + signals + stats.

Click on chart to enlarge.

VSTpro 2010/2011/2012 sample trade results. (US stocks)

Click on links below.

2010 | 2011 | Details | Disclaimer

GICS Indices vs ASX 200 16/3/2012

Click on image to enlarge.

MetaStock Training-Live-Webinar-Learn-Classes-click here

Banks vs ASX 200 16/3/2012

Click on image to enlarge.

Using the VSTpro to test indicator modification.Part 2

The ASX - MINERAL RESOURCES. ORDINARY (MIN) charts displayed have notes attached describing the three different setups.

Click on the charts to enlarge,and view the results in the stats section on the left of each chart.

Click on images to enlarge.


Using the VSTpro to test indicator modification.

While using the VSTpro to perform tests on ASX stocks the indicator in use at the time was applied to a chart of the ASX (XJO), and charts 1 & 2 display the results.

The charts display good robust numbers, and curiosity lead to adding an extra option to the indicator.

The original indicator referenced S&P500 or Chart data. The indicator has now been modified to include ASX (XJO) data.

Early testing results using the ASX (XJO) data reference indicate a reduction in Risk when applied to ASX stocks.

The FREE VST and VSTpro have open code that can be modified by the user.


NOTE:Comment regarding charts 1 & 2 from Jose Silva of metastocktools.com

"One observation: the two ASX200 charts' amazing profit smoothness are mostly due
to using the Open of the next day (2hrs after US markets close). However, the
Open of the ASX indices is basically the previous day's close (i.e. not
available for trading), so there is a large element of hindsight involved there."

Click on image to enlarge.


Click on image to enlarge.


VSTpro 2010/2011/2012 sample trade results. (US stocks)

Click on links below.

2010 | 2011 | Details | Disclaimer

GICS Indices vs ASX 200 9/3/2012

Click on image to enlarge.

MetaStock Training-Live-Webinar-Learn-Classes-click here

Banks vs ASX 200 9/3/2012

Click on image to enlarge.

MetaStock Training-Live-Webinar-Learn-Classes-click here

VSTpro 2010/2011/2012 sample trade results. (US stocks)

Click on links below.

2010 | 2011 | Details | Disclaimer

GICS Indices vs ASX 200 2/3/2012

Click on image to enlarge.

MetaStock Training-Live-Webinar-Learn-Classes-click here

Banks vs ASX 200 2/3/2012

Click on image to enlarge.

MetaStock Training-Live-Webinar-Learn-Classes-click here

VSTpro Long - Time template.

Charts displayed below have the VSTpro Long - Time template applied.

Settings for all charts are identical.

  • VSTpro Long - Date Filter indicator is set at 4/10/2011 to 21/2/2012.
  • VSTpro Long - Time Profit indicator set to Buy/Hold & zero for Transaction Costs.


Click on images to enlarge.


VSTpro 2010/2011/2012 sample trade results. (US stocks)

Click on links below.

2010 | 2011 | Details | Disclaimer

GICS Indices vs ASX 200 17/2/2012

Click on image to enlarge.

MetaStock Training-Live-Webinar-Learn-Classes-click here
 
Design Credit Best Blogger Tips | Best Blogger Templates | Best Social Icons